This article will provide an overview of the report feature.
| Important: Shopping Cart transactions can generate Opportunities; however, Opportunities created from those transactions are not added to the Sales Pipeline at this time. Please accommodate this in your pipeline analysis. |
| Administrators | ✓ | |
| Company Managers | ✓ | |
| Marketing Managers | ||
| Sales Managers | ✓ | |
| Salespersons | ✓ | |
| Jr. Salespersons | ✓ |
| Tip: Are you looking for information about Constant Contact’s Email and Digital Marketing product? This article is for Constant Contact’s Lead Gen & CRM product. Head on over to the Email and Digital Marketing articles by clicking here. Not sure what the difference is? Read this article. |
The Pipeline Report section of Lead Gen & CRM displays information on the various aspects of a pipeline. To view and utilize reports, do the following:
The Pipeline Value report shows all of the opportunities that are expected to close within a certain time period. This report is an excellent tool for forecasting sales.
Each stage of the pipeline provides data for the Expected Value and Total Value of all opportunities currently in that stage.
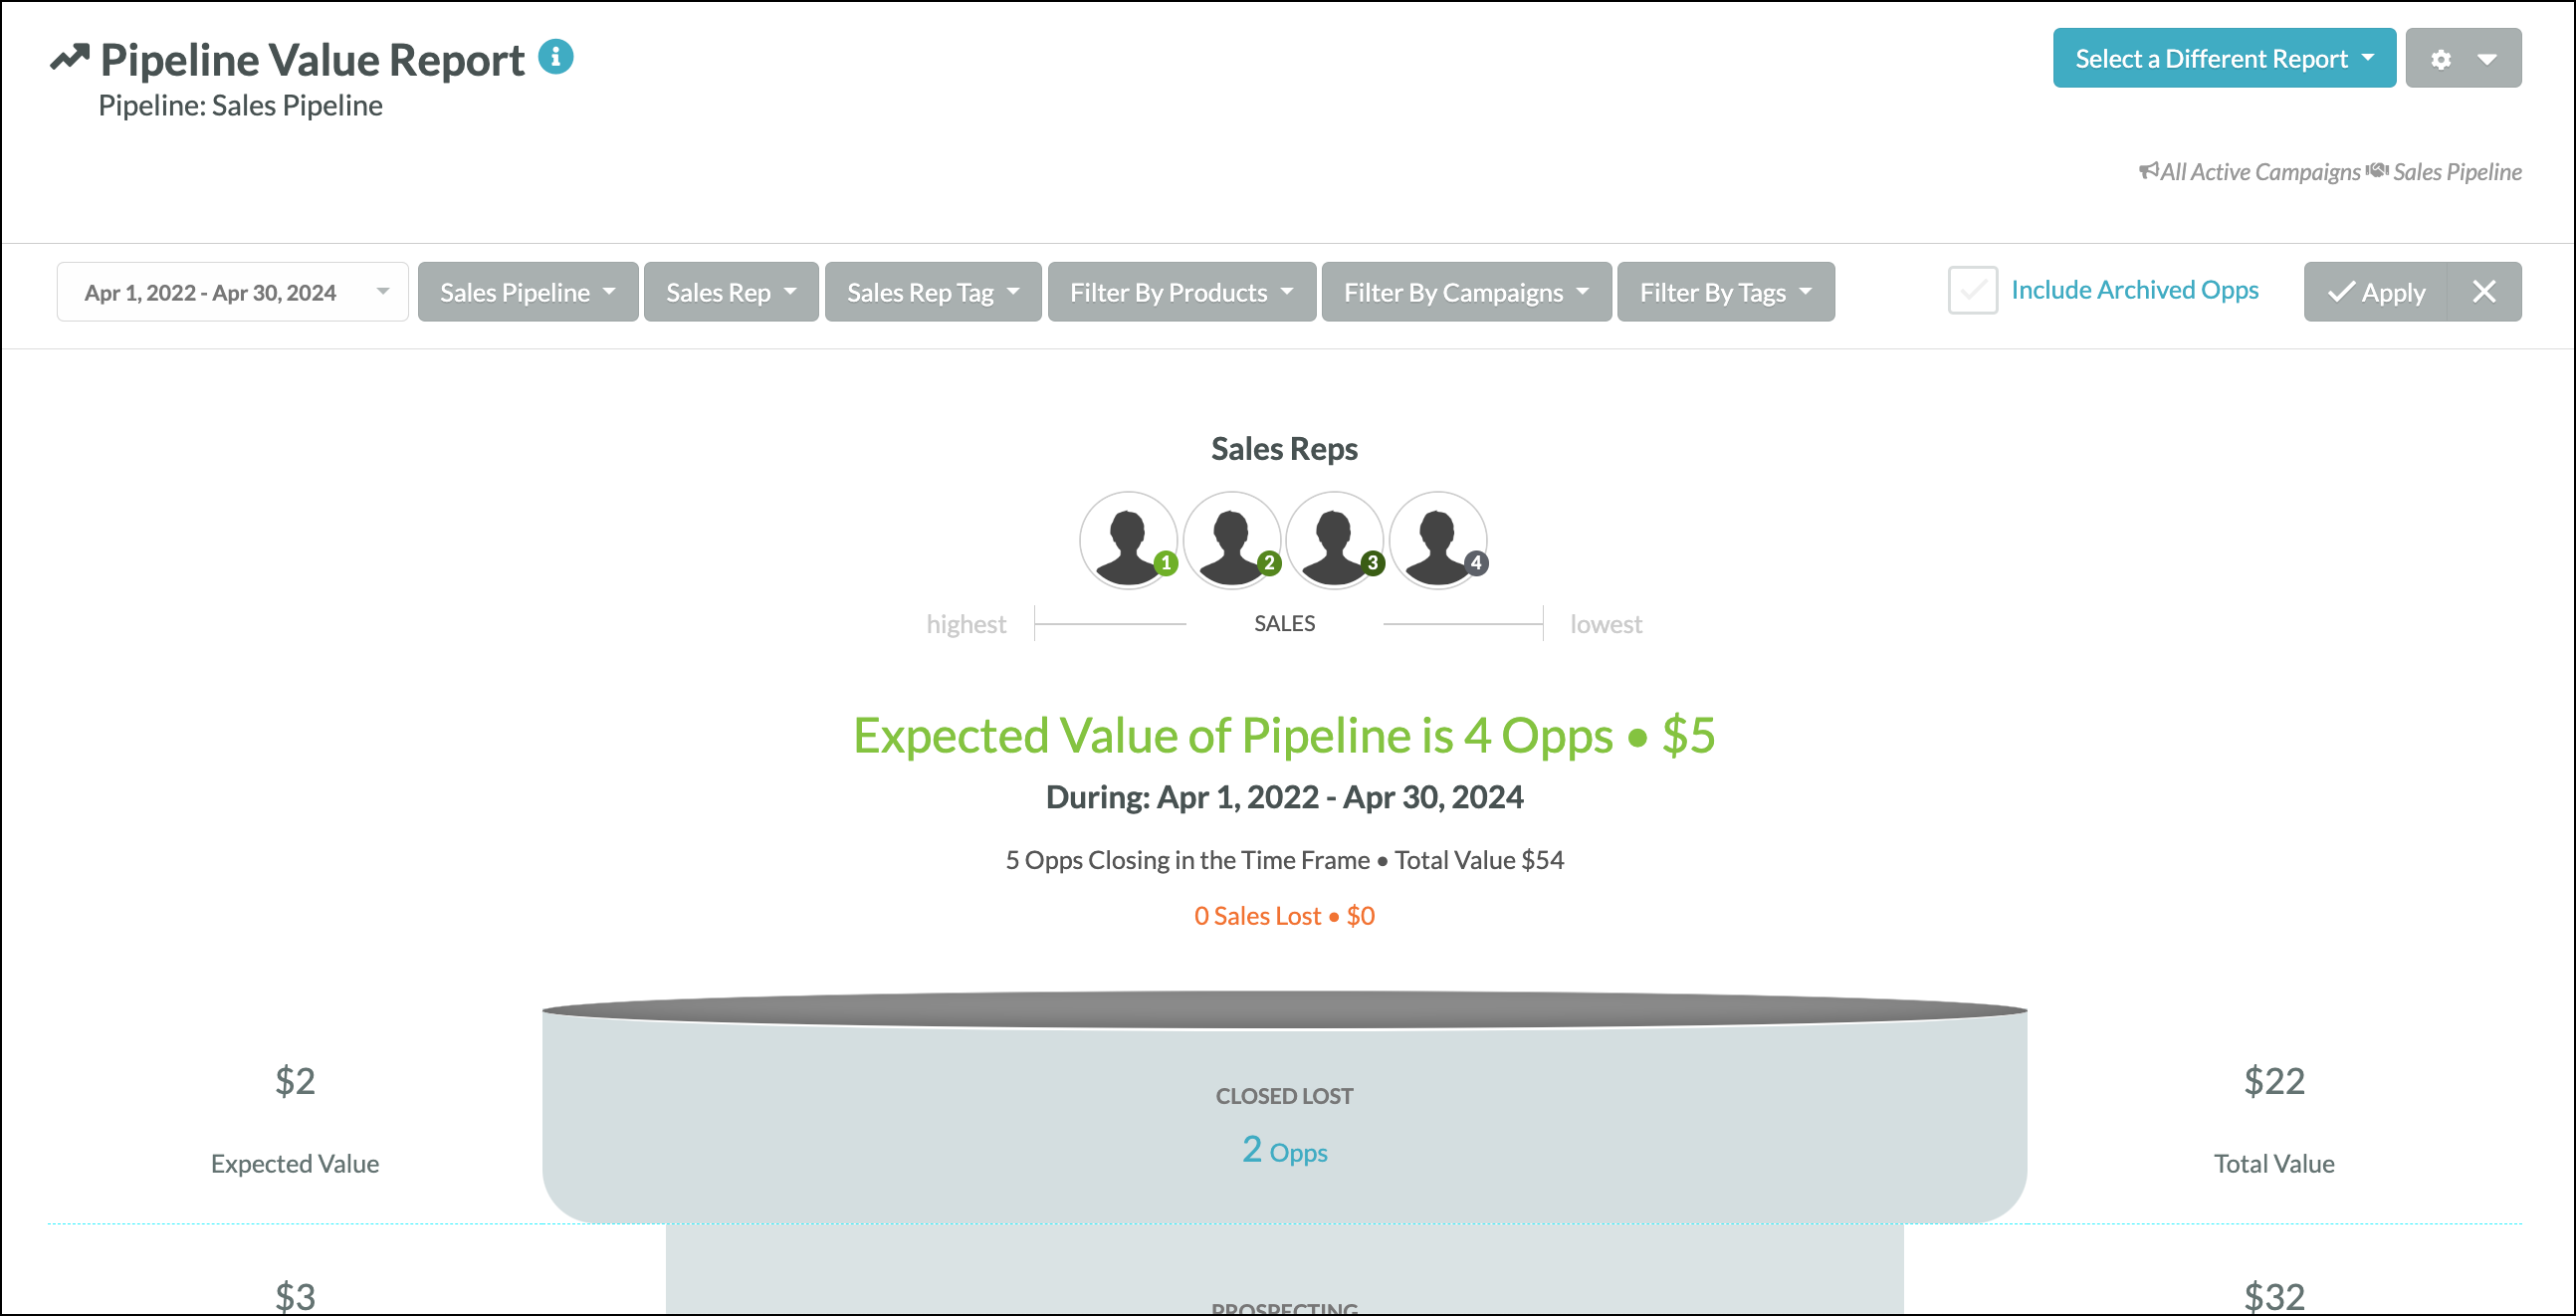
Refer to Pipeline Value Report Overview for more information on Pipeline Value reports.
The Opportunity Health Report allows you to see how your pipeline opportunities are performing. This report shows many different things about opportunities, including:

Refer to Opportunity Health Report Overview for more information on Opportunity Health reports.
The Conversion Analysis report shows the current stage of every opportunity created during a specified date range. This report is useful for showing the quality of the opportunities you have created and the conversion rates of your sales staff.
Refer to Conversion Analysis Report Overview for more information on Conversion Analysis reports.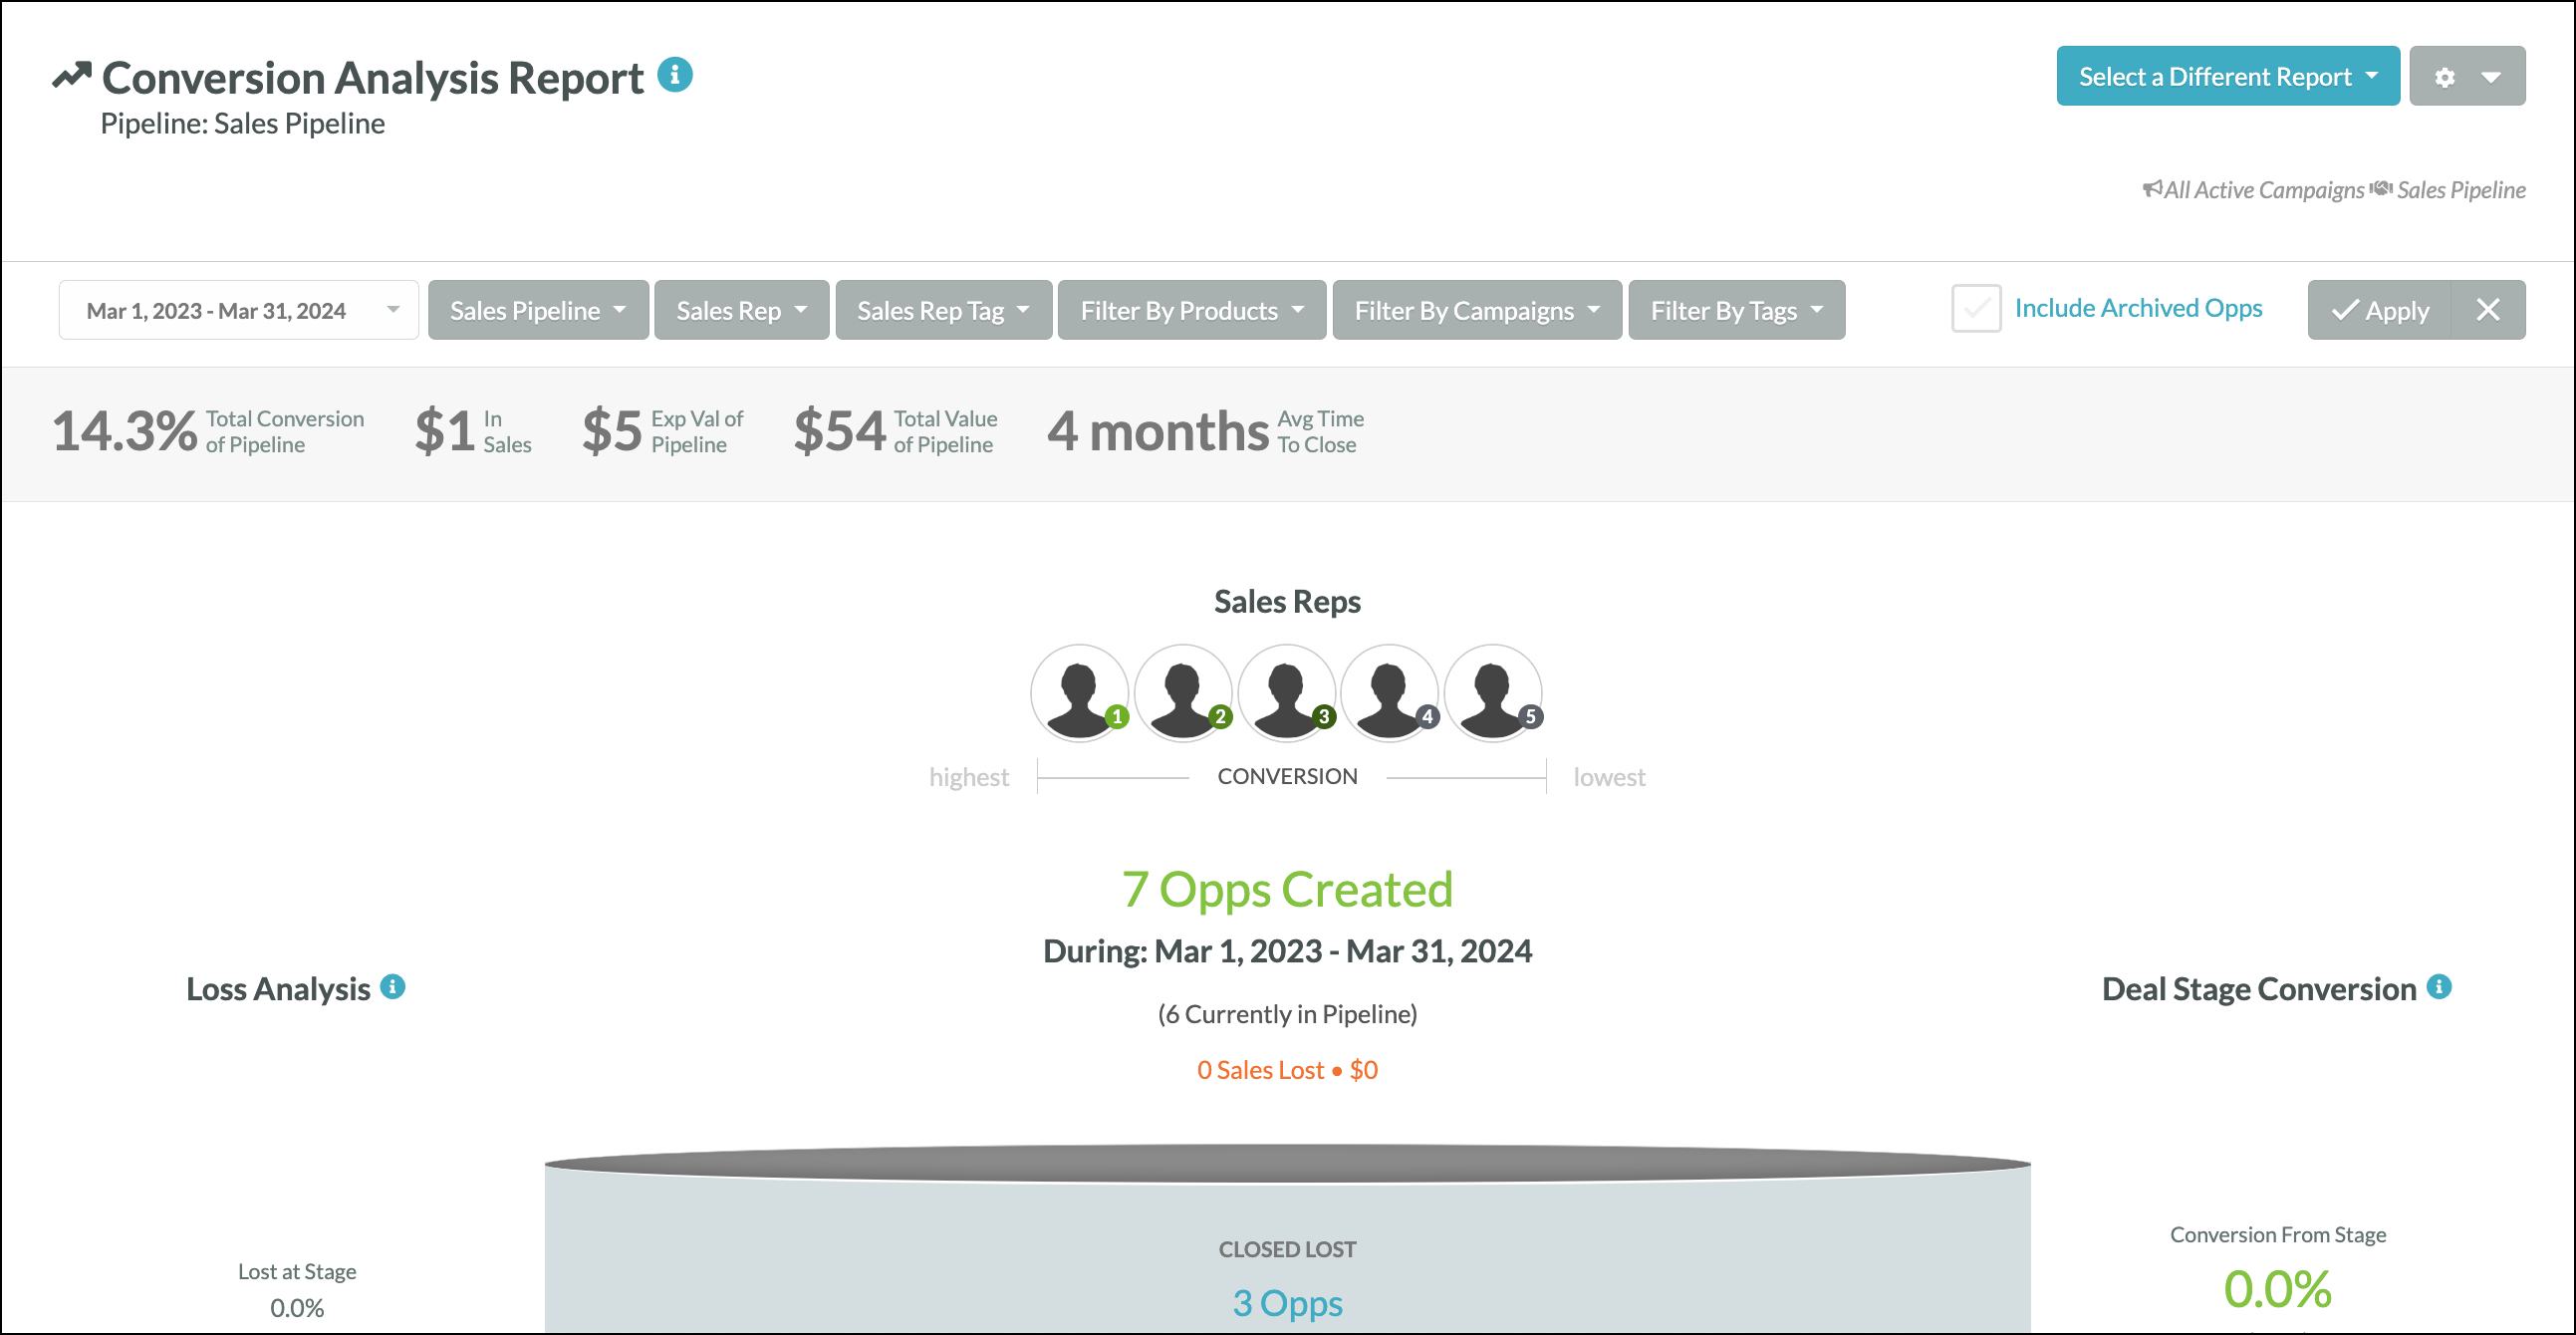
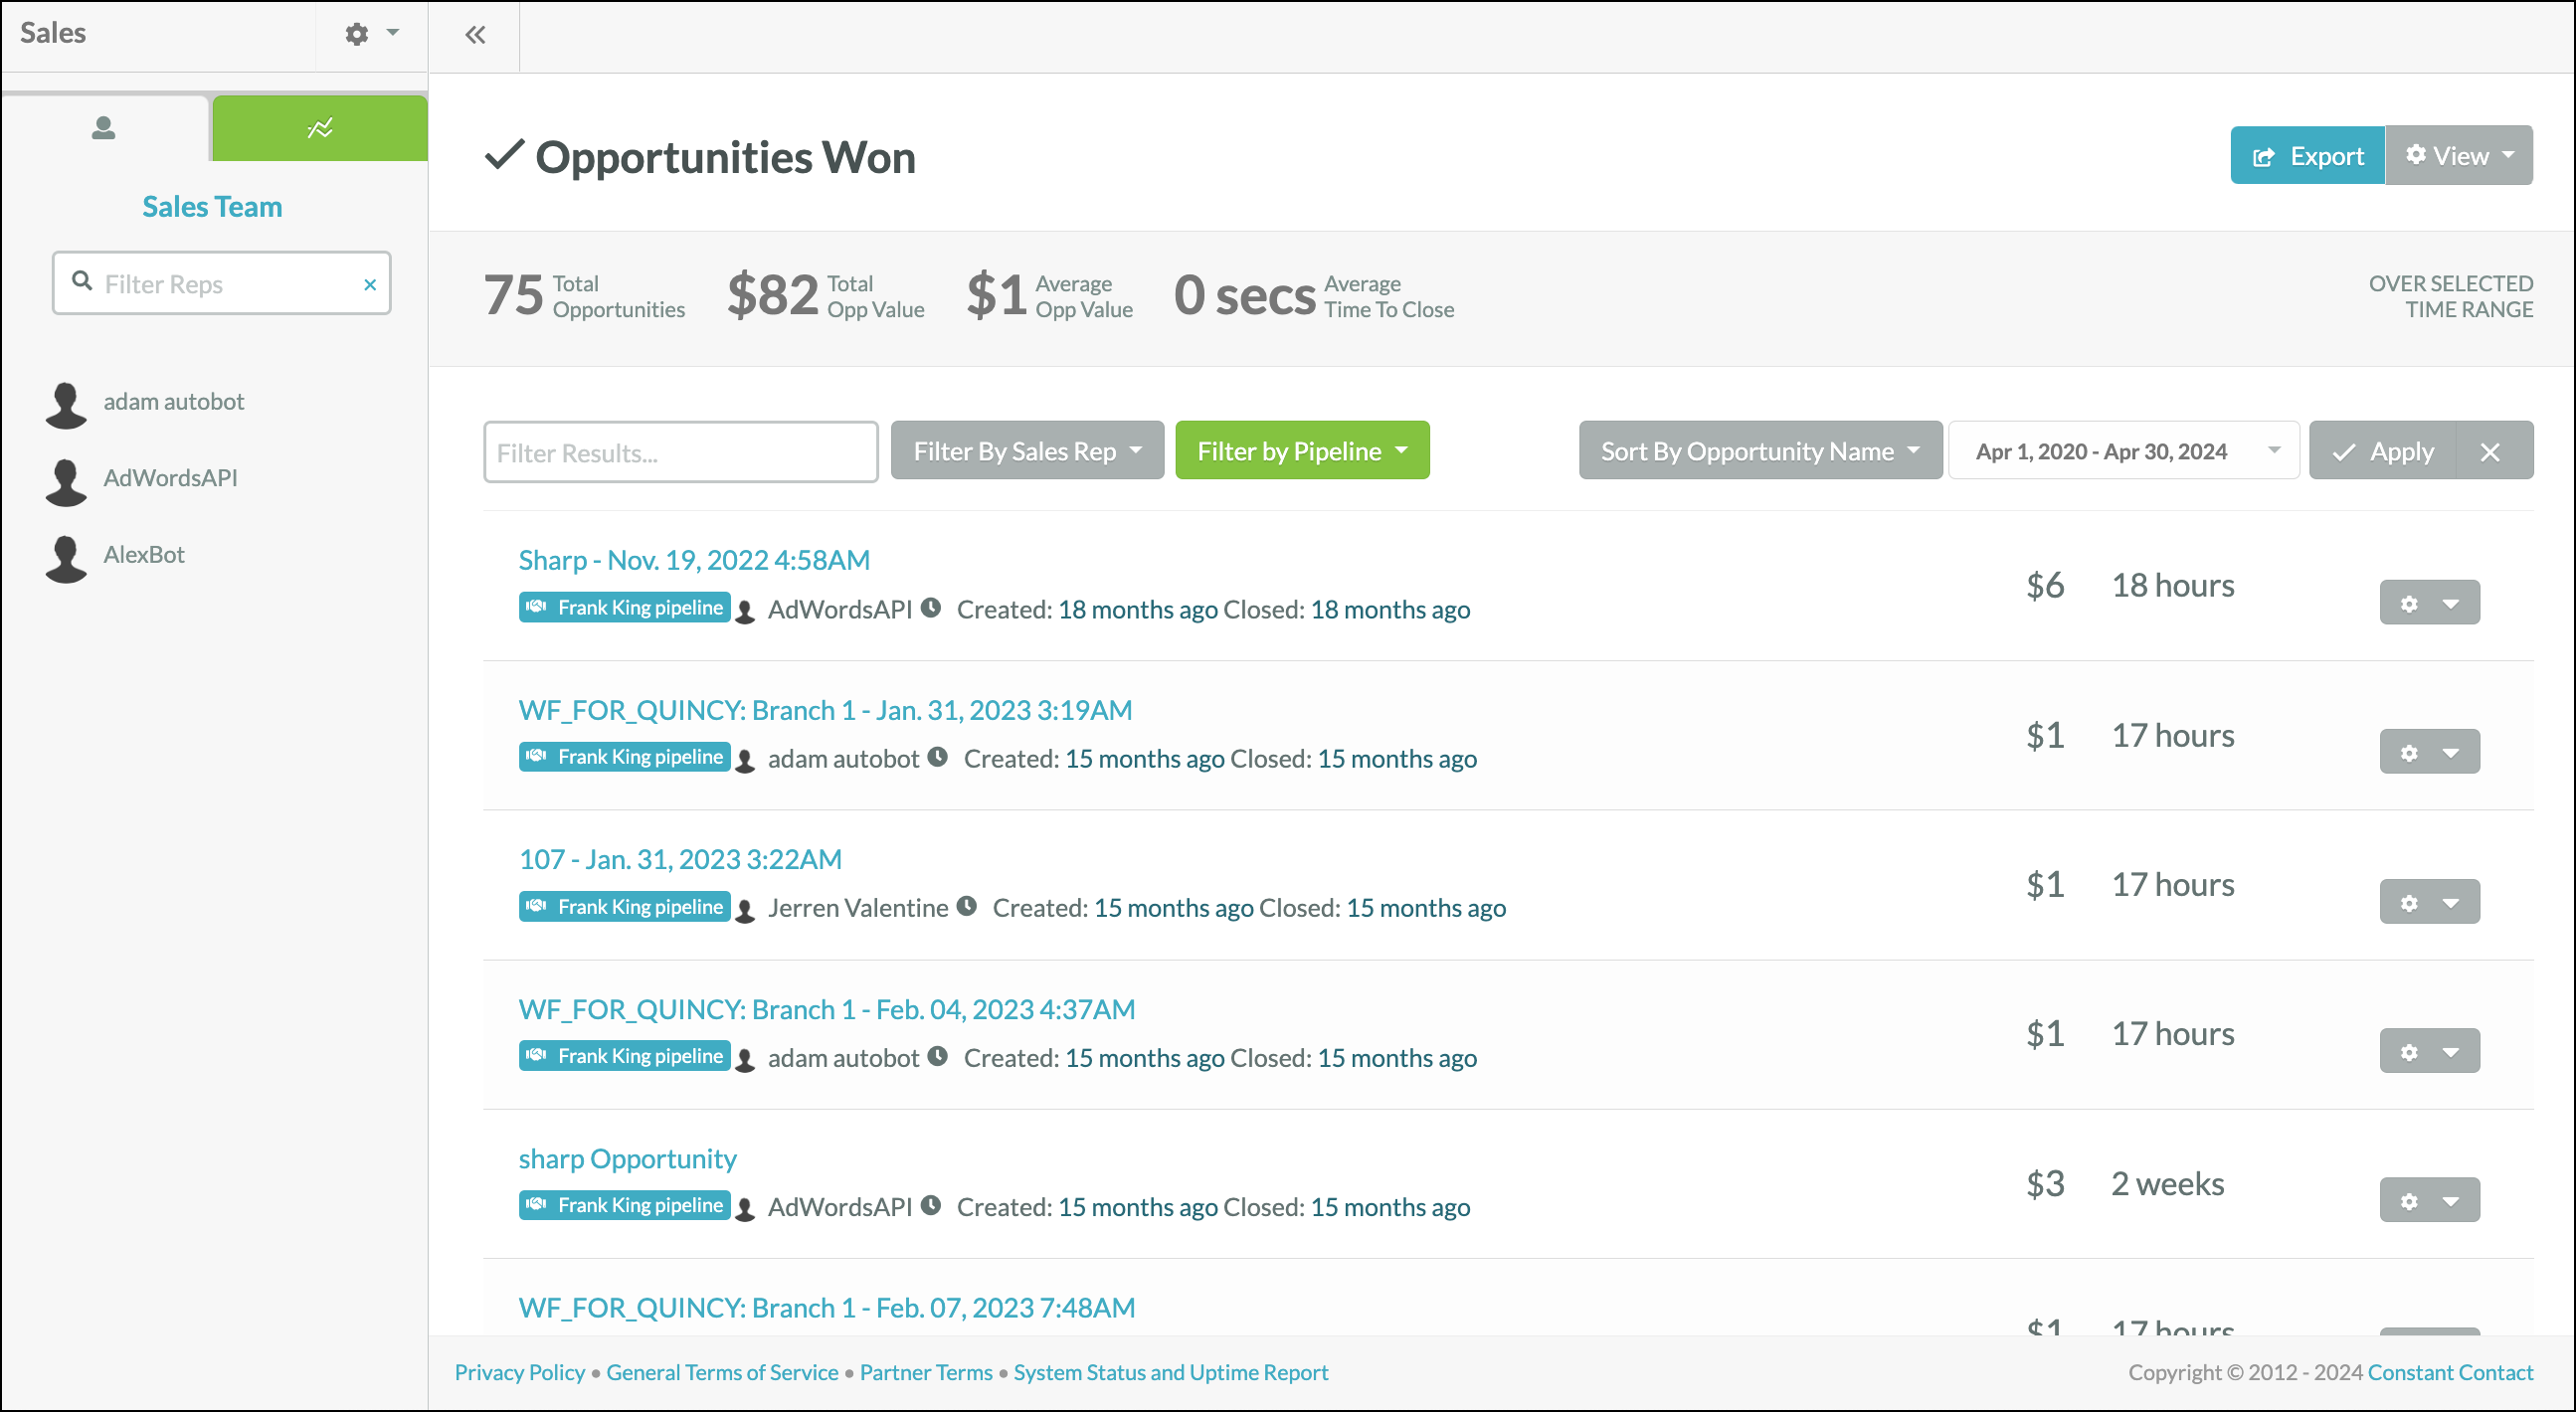
Refer to Won/Lost Report Overview for more information on Won/Lost reports.
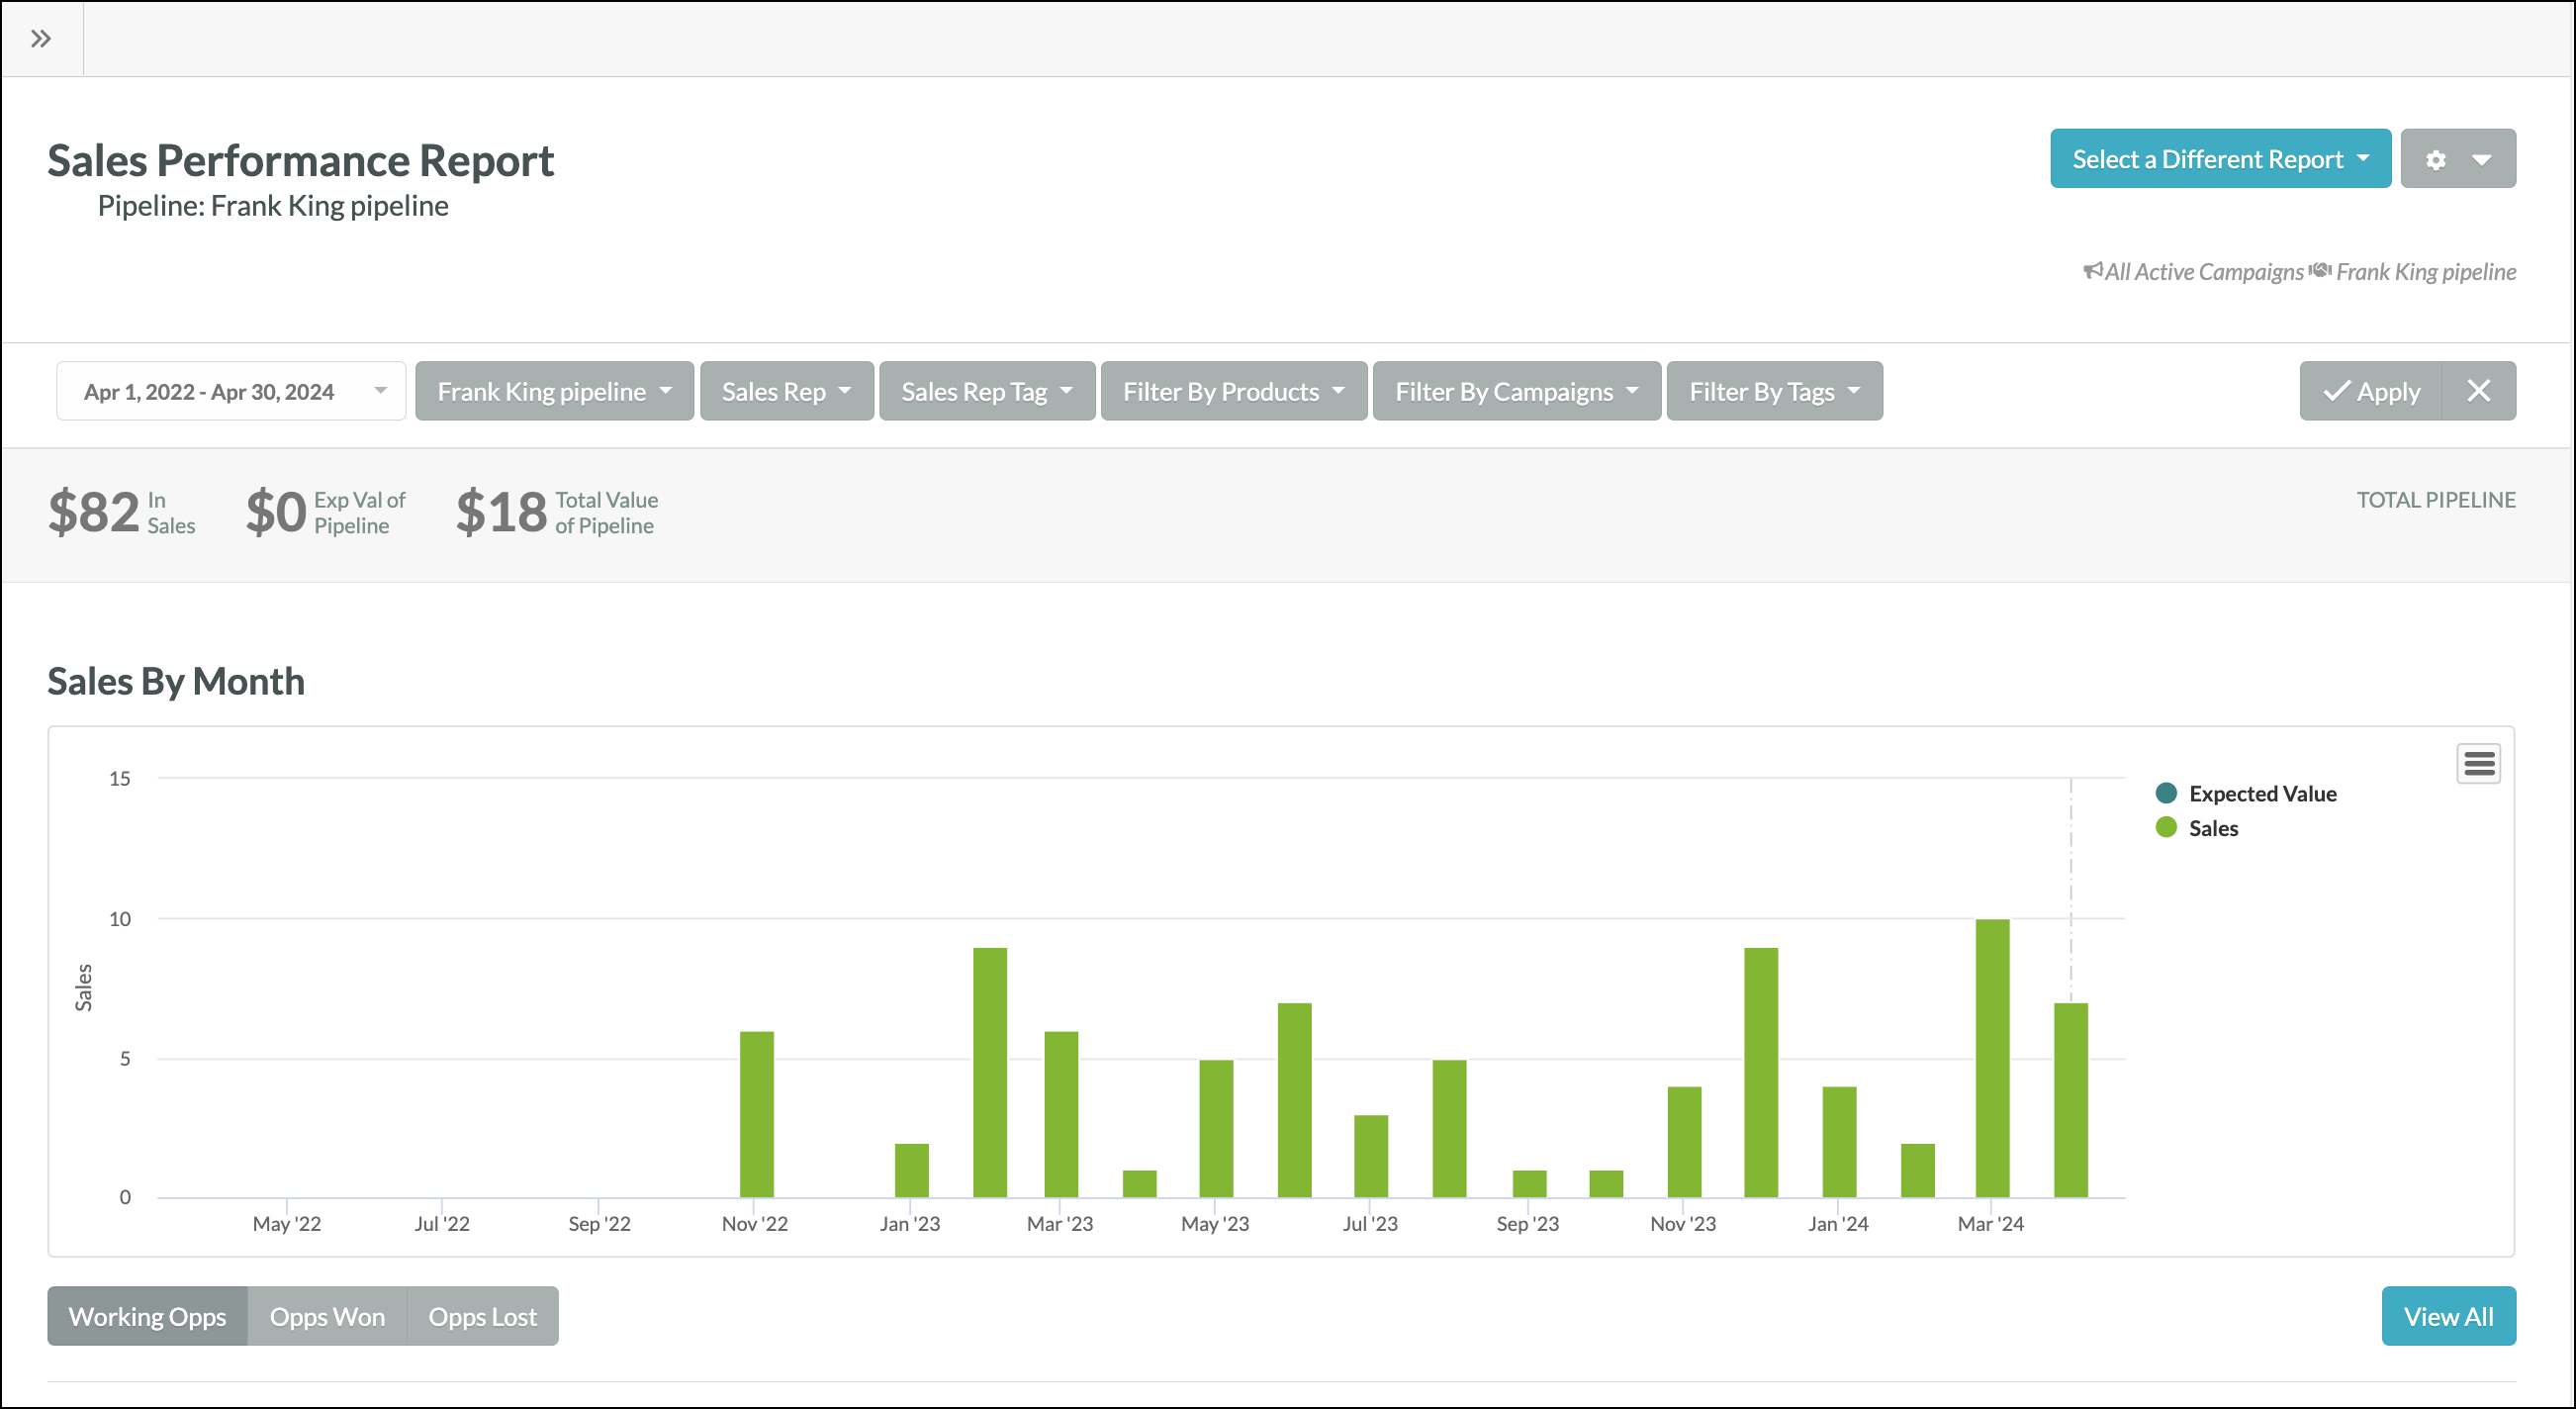
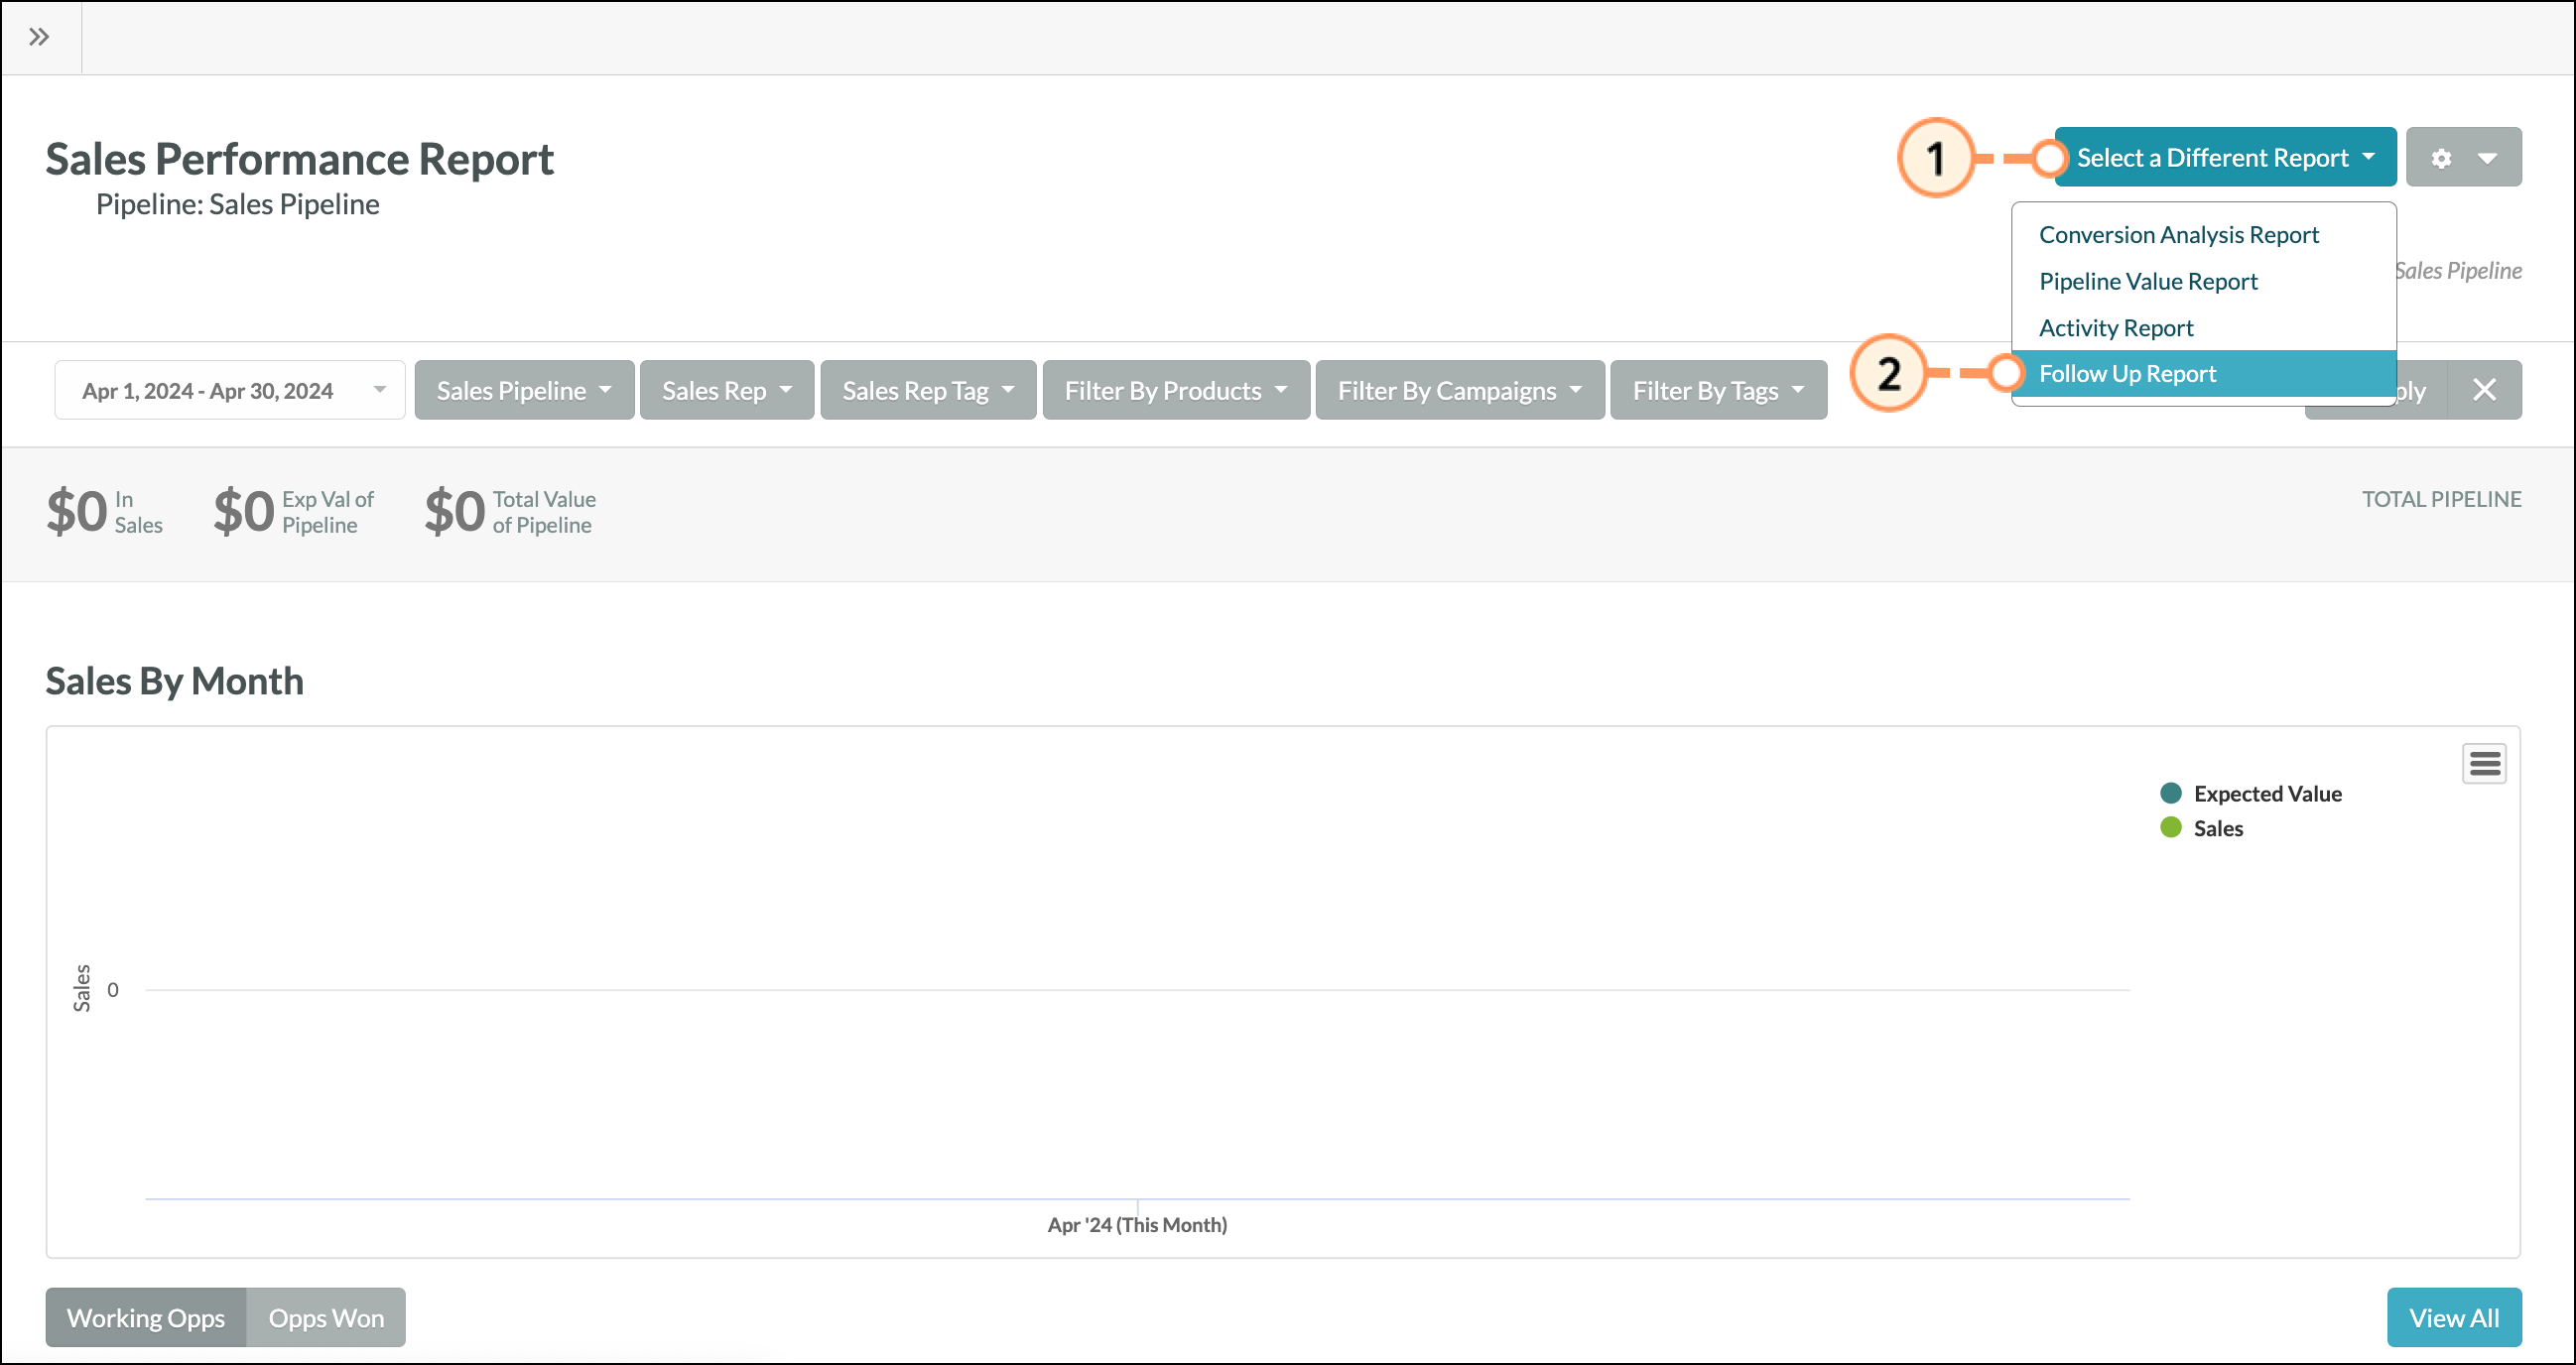
The Sales Performance report enables you to ensure your sales team is on track to meet key goals by estimating the total and expected value of your pipeline. Filter by sales rep to measure performance and improve your sales strategy.
Refer to Sales Performance Report Overview for more information on Sales Performance reports.
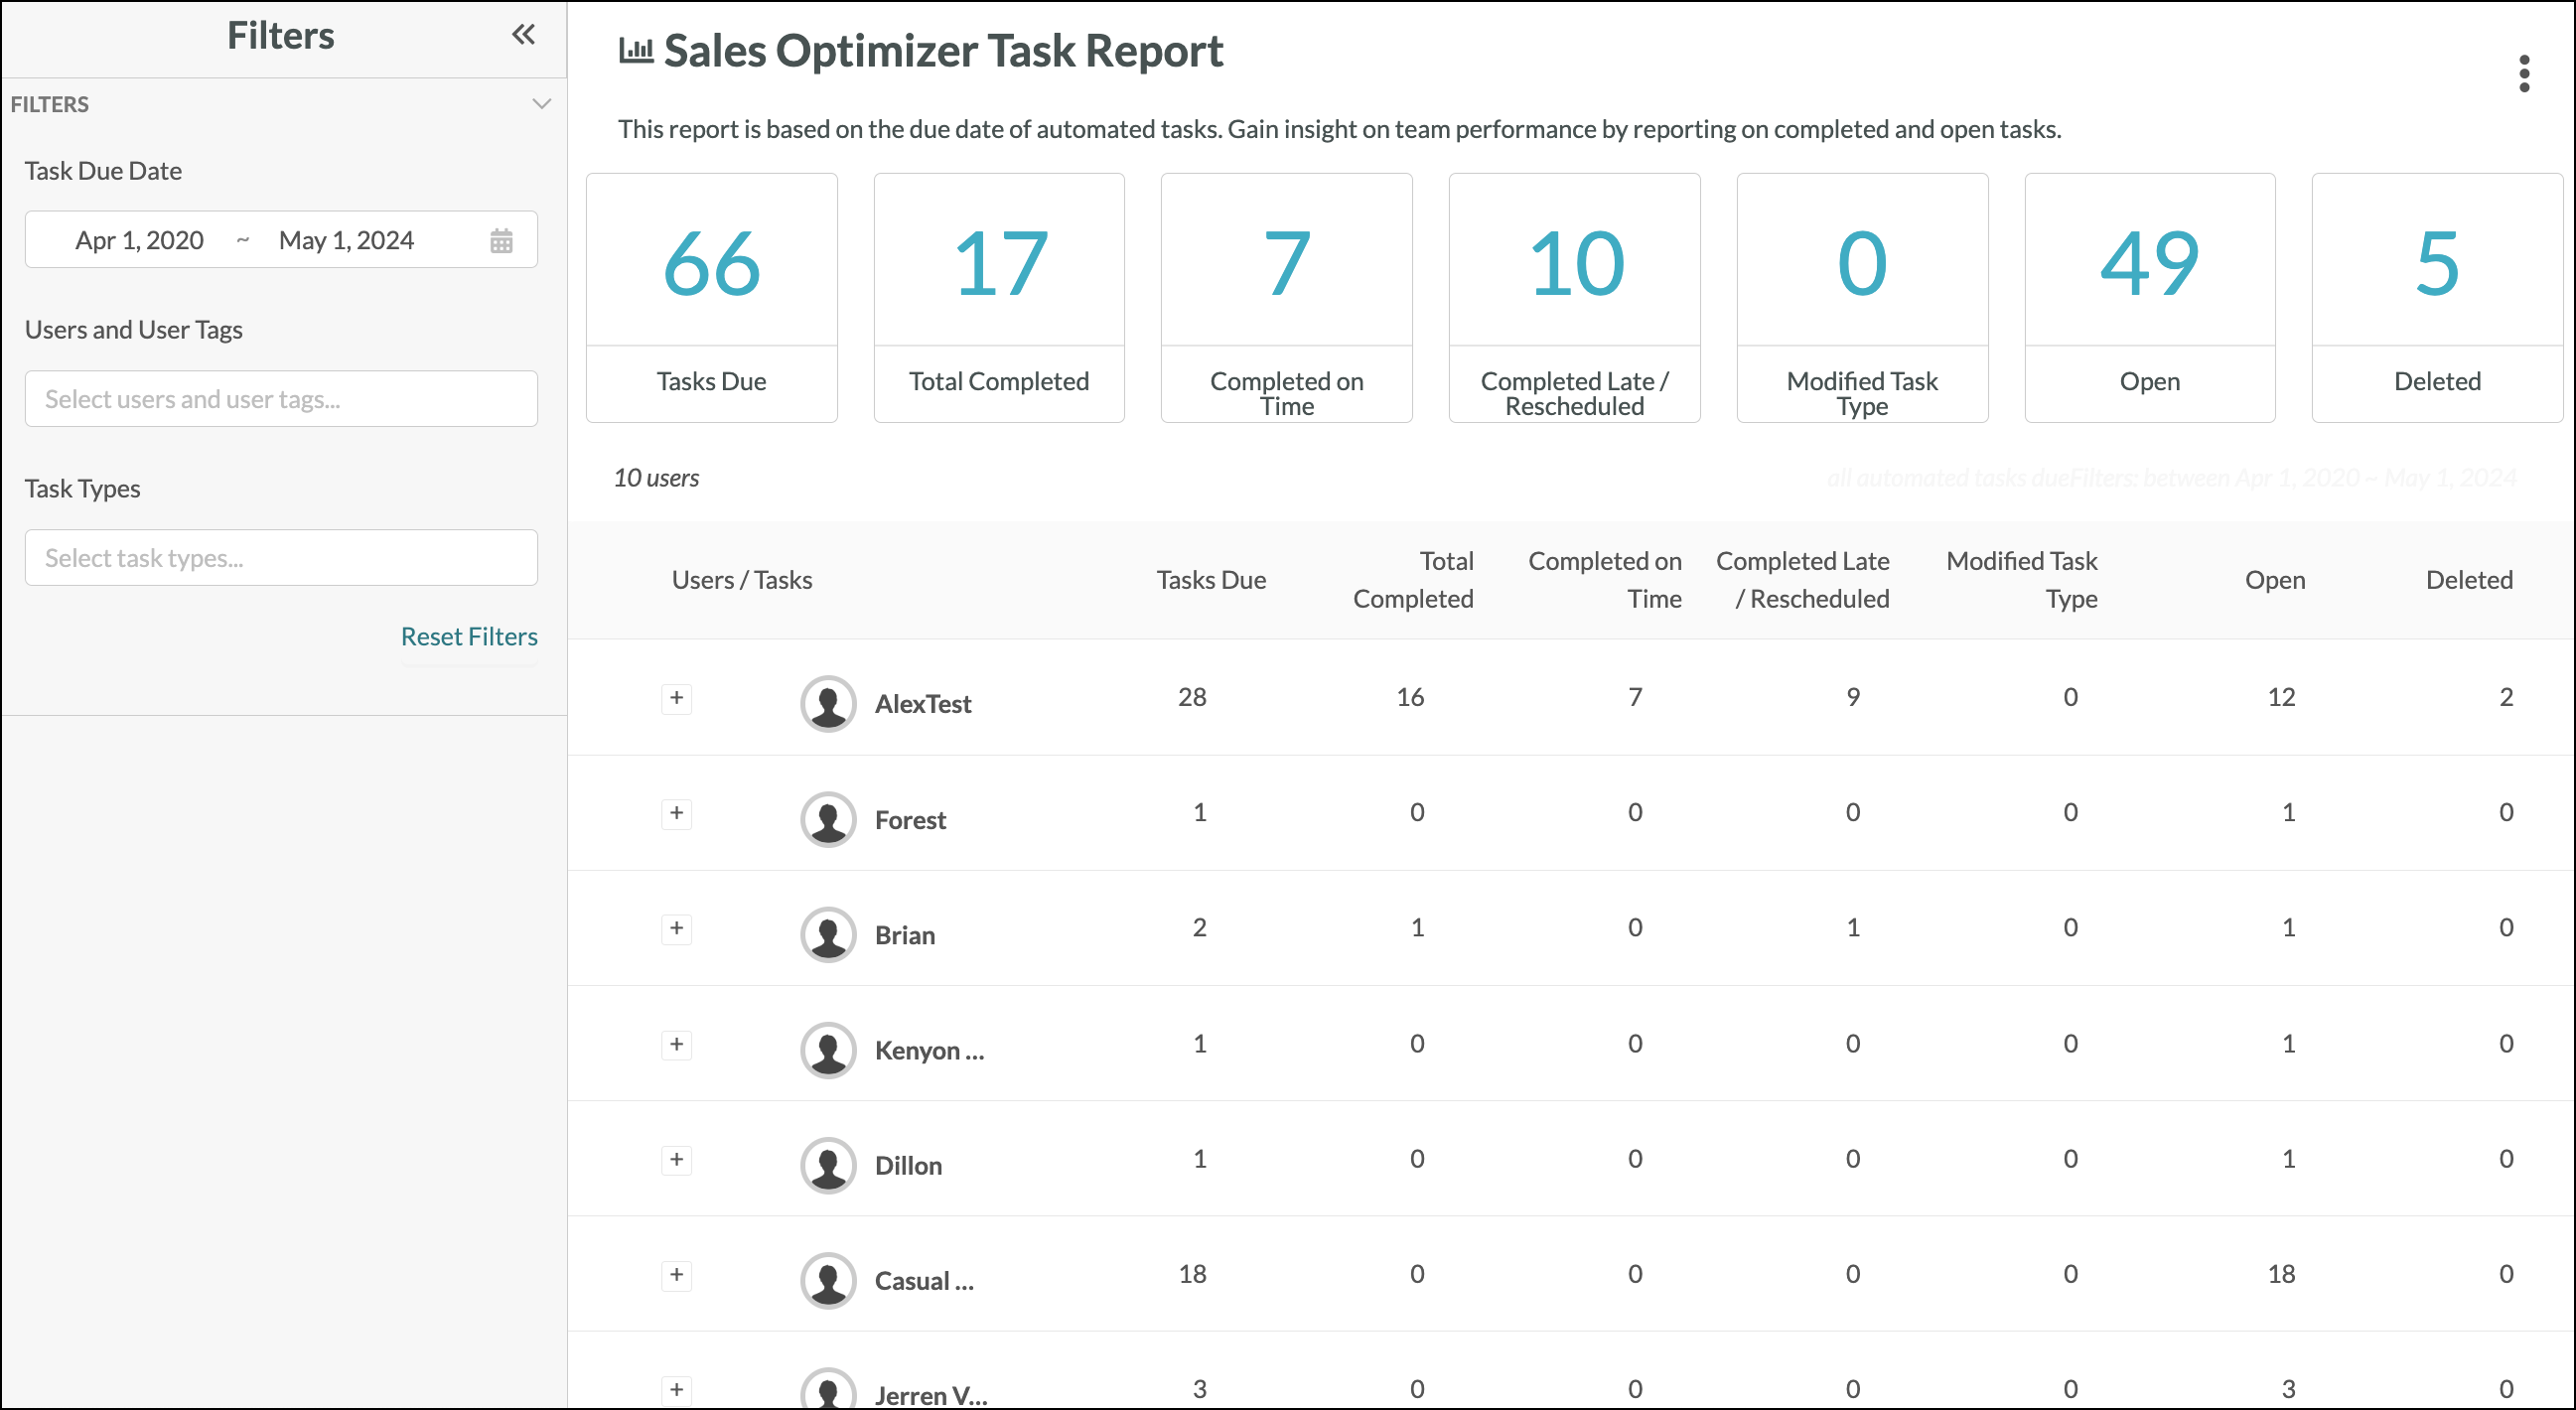
Refer to Sales Optimizer Tasks Report Overview for more information on the Sales Optimizer Tasks reports.
The Activity report allows you to view important tasks, notes, and statuses for a filtered set of opportunities. Access the Activity report from other reports by clicking Select a Different Report > Activity Report.

You can choose to see activity based on the sales reps and tags, pipelines, deal stages, and both opportunities with and without activity.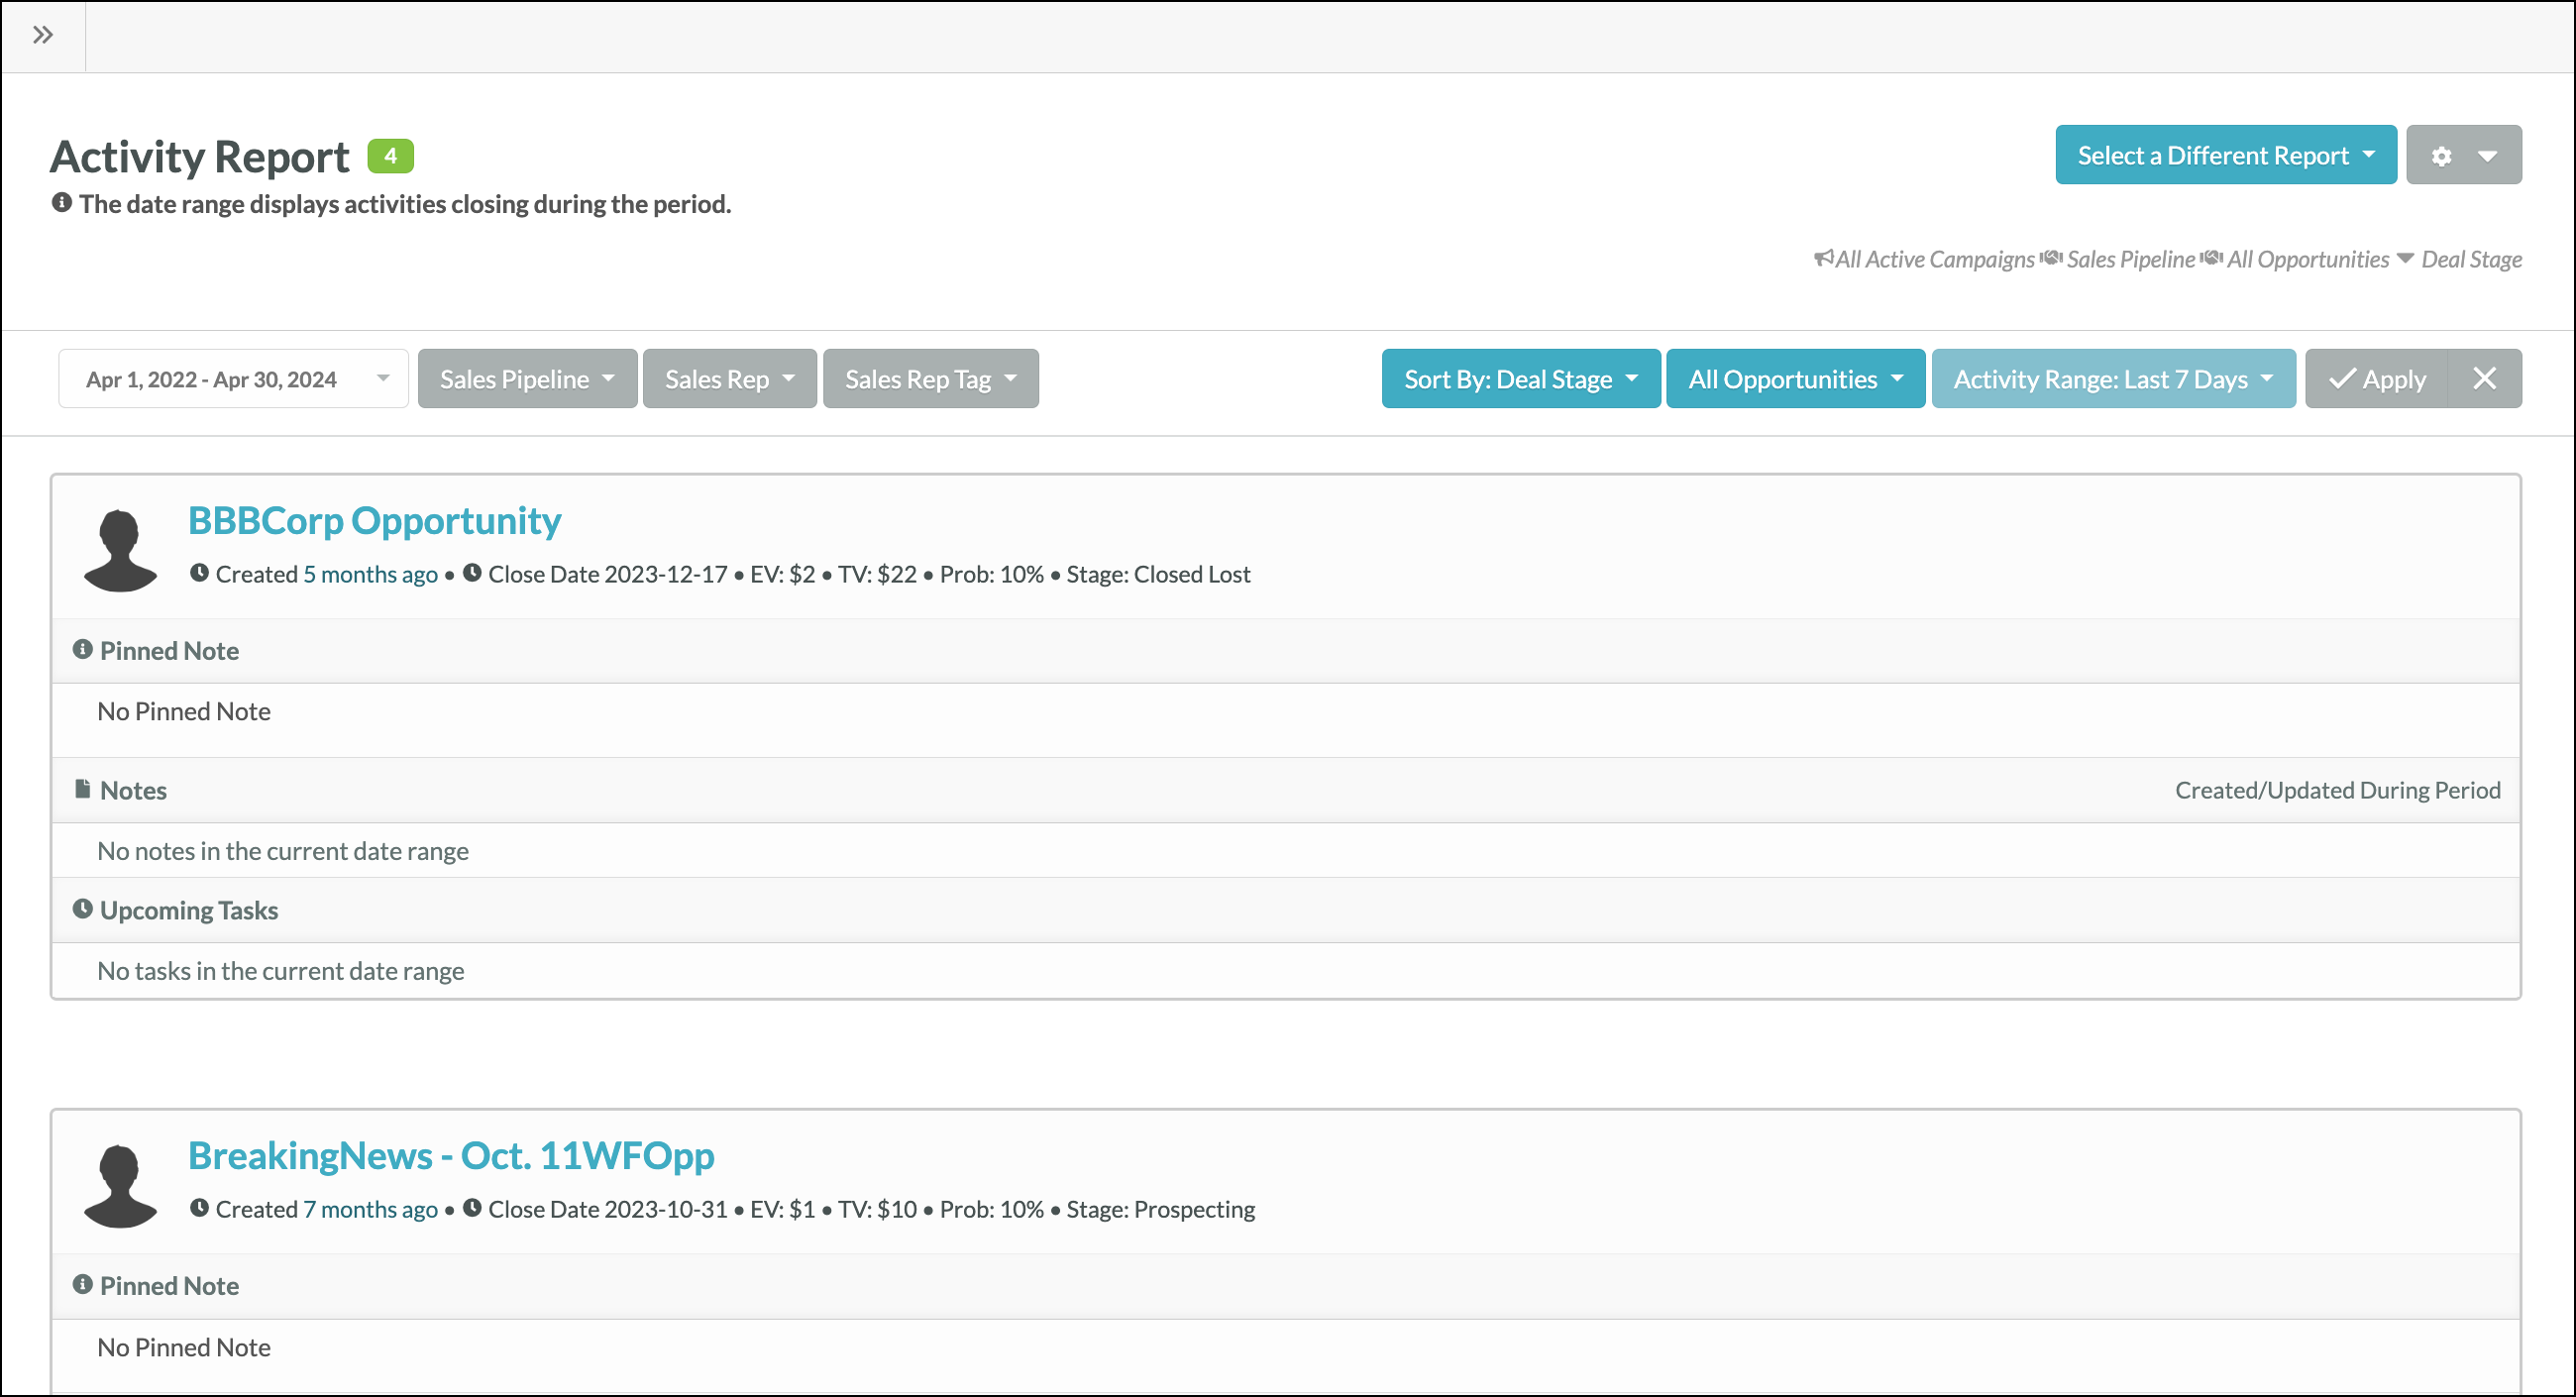
This report is useful for showing what is actually going on inside of a specific opportunity by giving you a more granular view of the activity within your sales organization:
When creating a pipeline stage, you can choose to set a standard for how often you should email or call leads associated with that opportunity.
The associated report, the Follow-Up report, shows how many calls or emails you should have sent alongside the calls and emails you actually sent.
Access the Follow-Up report from other reports by clicking Select a Different Report > Follow-Up Report.
The number of logged calls shows up as the Total, and the number or calls you should have made shows up as the Goal. It is the same for emails. The Total number of emails are the number of IMAP emails and smart emails sent to contacts that are associated with that opportunity. The Goal is the number of emails designated in the Sales Automation Policy for the deal stage.
Below is a breakdown of the analytics for the Follow Up Report:
|
|
|
Once the reports have been created, you can save them and schedule them to be sent via email at a later date. Saved reports can be scheduled either from the report page itself or from the Manage Reports page.
Refer to Saving and Scheduling Reports for more information on saving and scheduling reports.
Copyright © 2026 · All Rights Reserved · Constant Contact · Privacy Center