This article will provide an overview of the Sales Performance report, as well as its available features.
| Administrators | ✓ | |
| Company Managers | ✓ | |
| Marketing Managers | ||
| Sales Managers | ✓ | |
| Salespersons | ✓ | |
| Jr. Salespersons | ✓ |
| Tip: Are you looking for information about Constant Contact’s Email and Digital Marketing product? This article is for Constant Contact’s Lead Gen & CRM product. Head on over to the Email and Digital Marketing articles by clicking here. Not sure what the difference is? Read this article. |
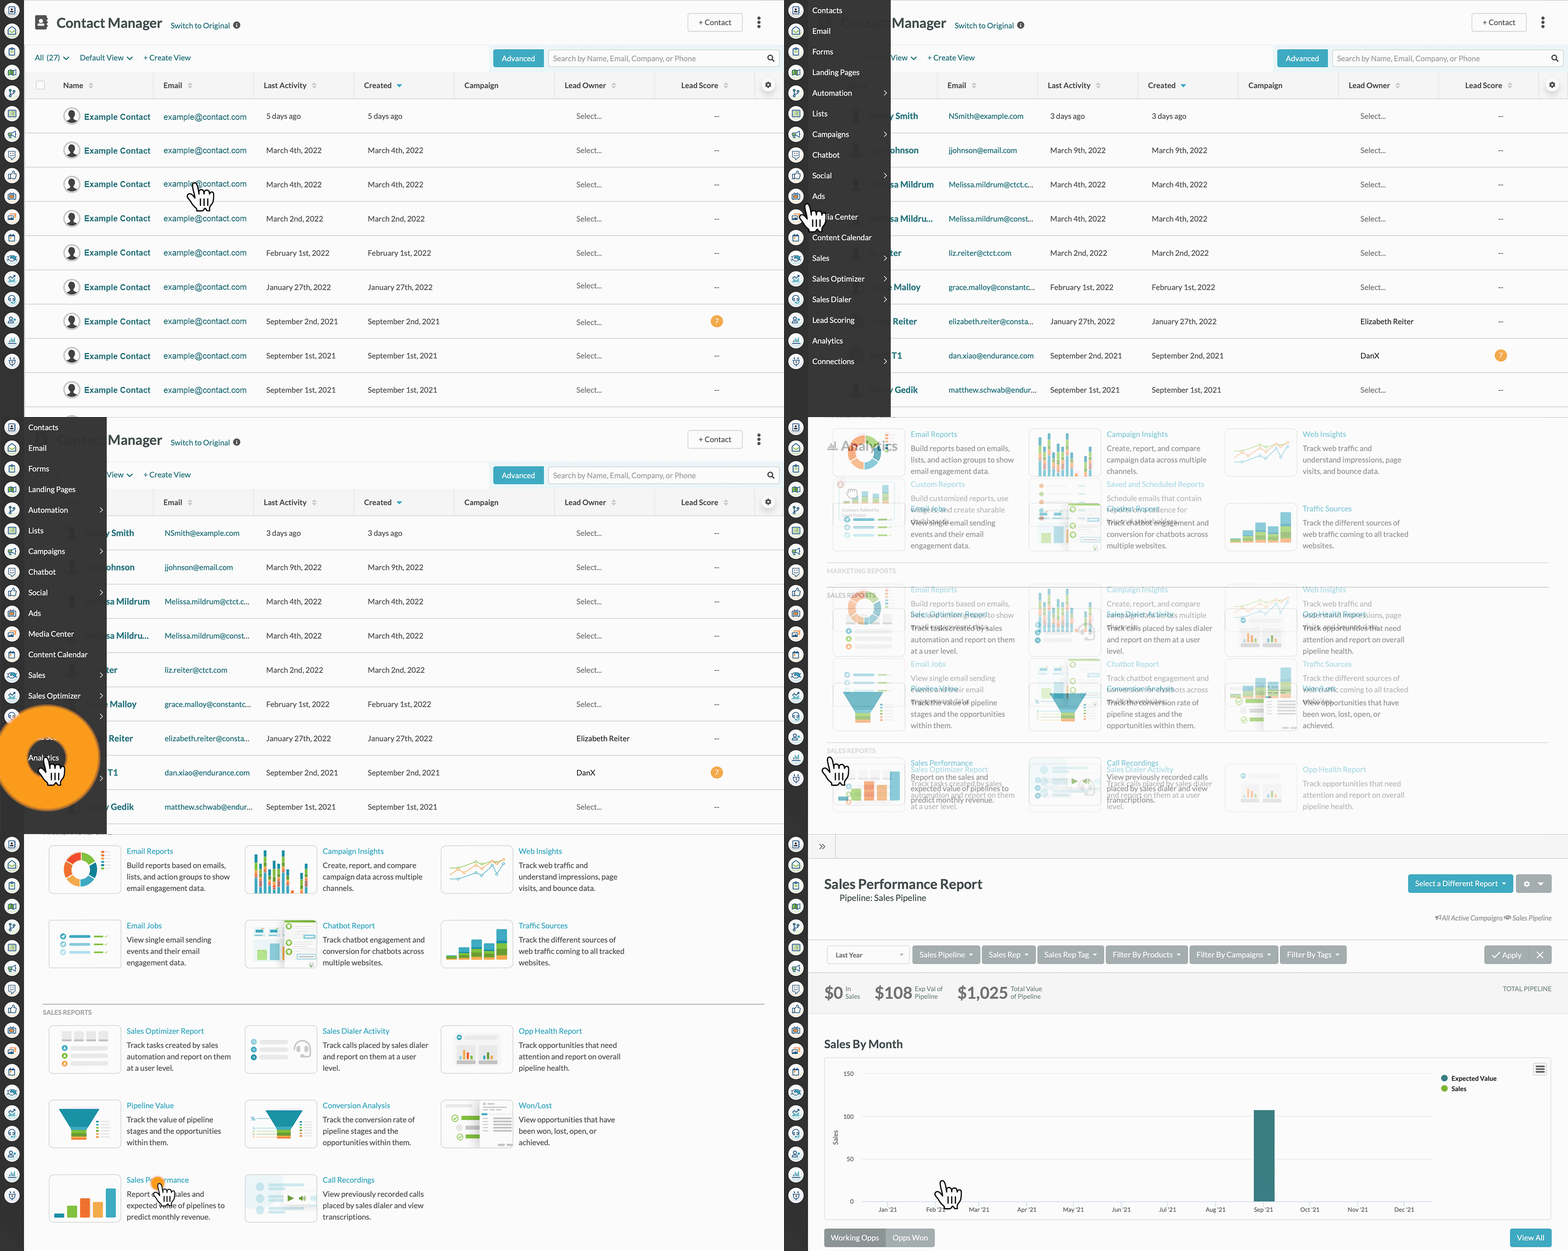
Click Analytics > Sales Performance to access the Sales Performance report in Lead Gen & CRM left toolbar.
The Sales Performance report provides information on estimates of the total and expected value of your pipeline. This report allows you to view how your sales representatives are doing. This way, you can measure performance and improve your sales strategy.
| Important: Shopping Cart transactions can generate Opportunities; however, Opportunities created from those transactions are not added to the Sales Pipeline at this time. Please accommodate this in your pipeline analysis. |
The Sales Performance report shows how sales and expected value compare with one another in a bar graph. 
In addition, the Sales Performance report provides a list of all opportunities—including value, close date, and the sales representative associated with it—over a specified period of time:
Clicking View All will display all opportunities that are within the Sales Center.
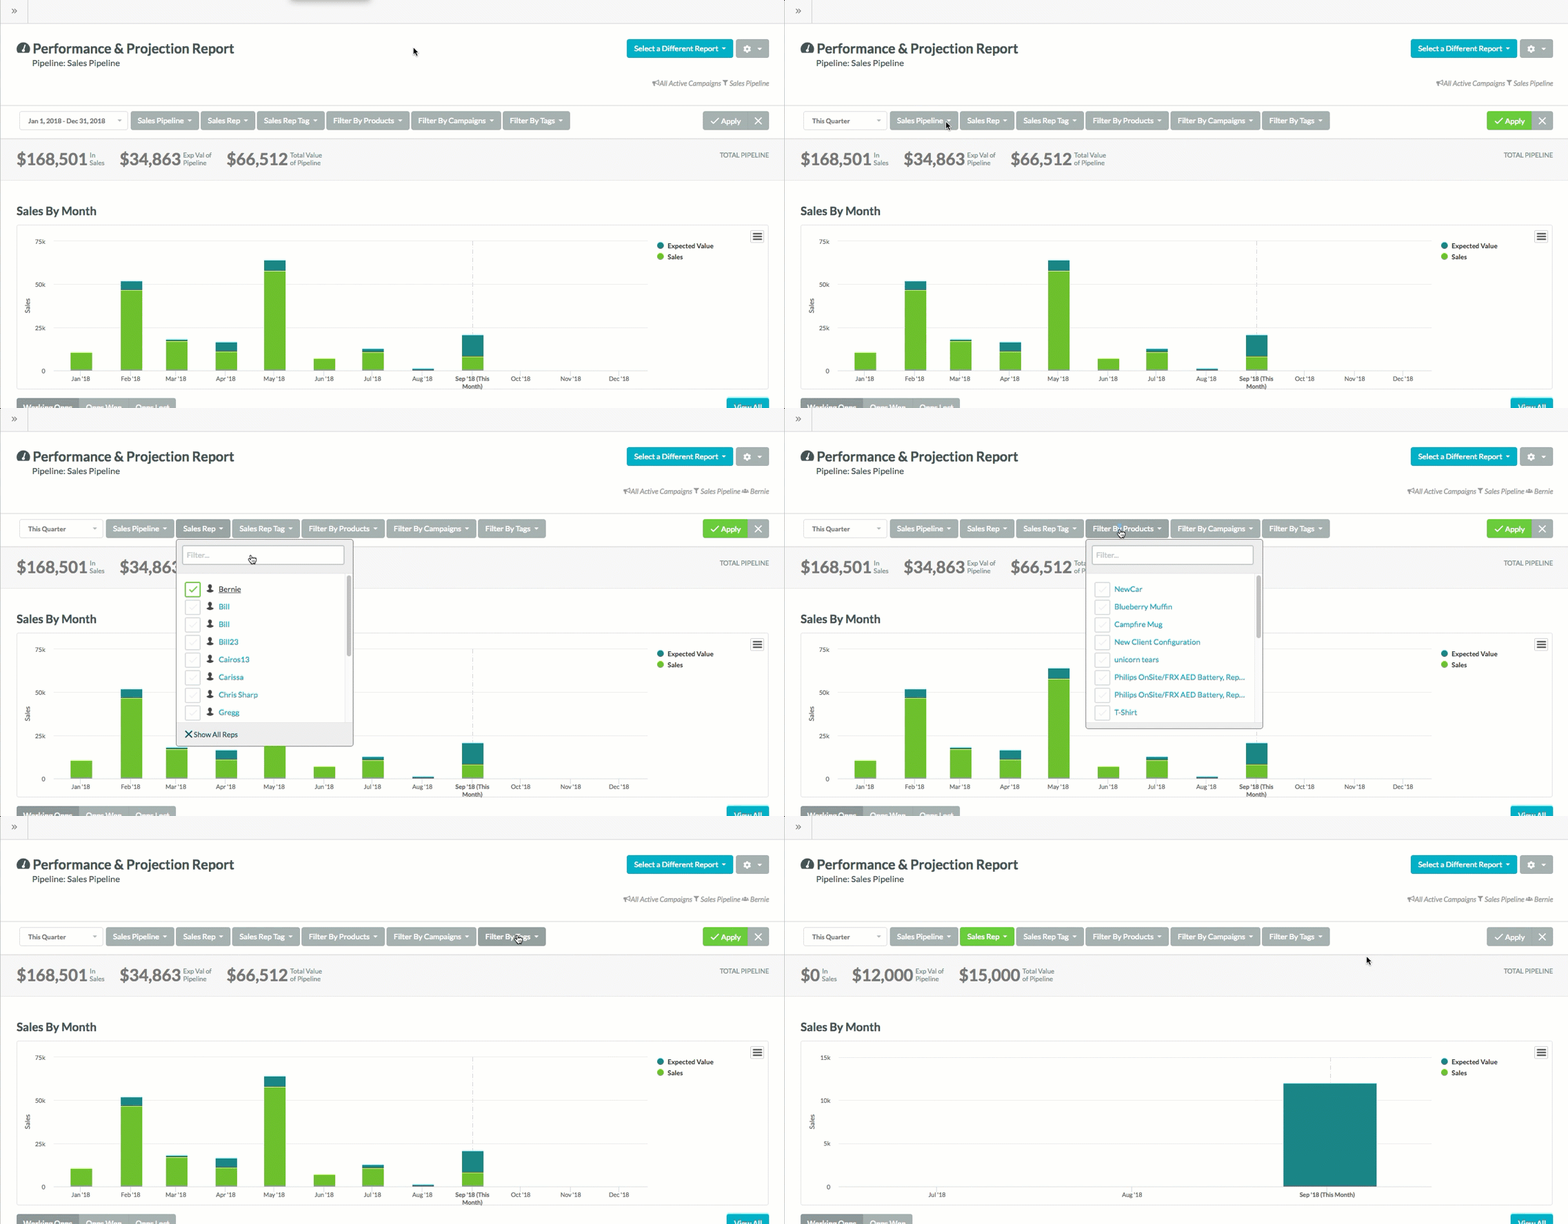
The Sales Performance report can be configured with data filters to show different details. You can use any or all of these filters. To configure Sales Performance report filters, do the following:

Note: Clicking on the opportunities in a pipeline stage will list their names. Clicking on the opportunity names will take you to their pages in Lead Gen & CRM.
Note: To reset report filters, click ![]() Clear Filters.
Clear Filters.
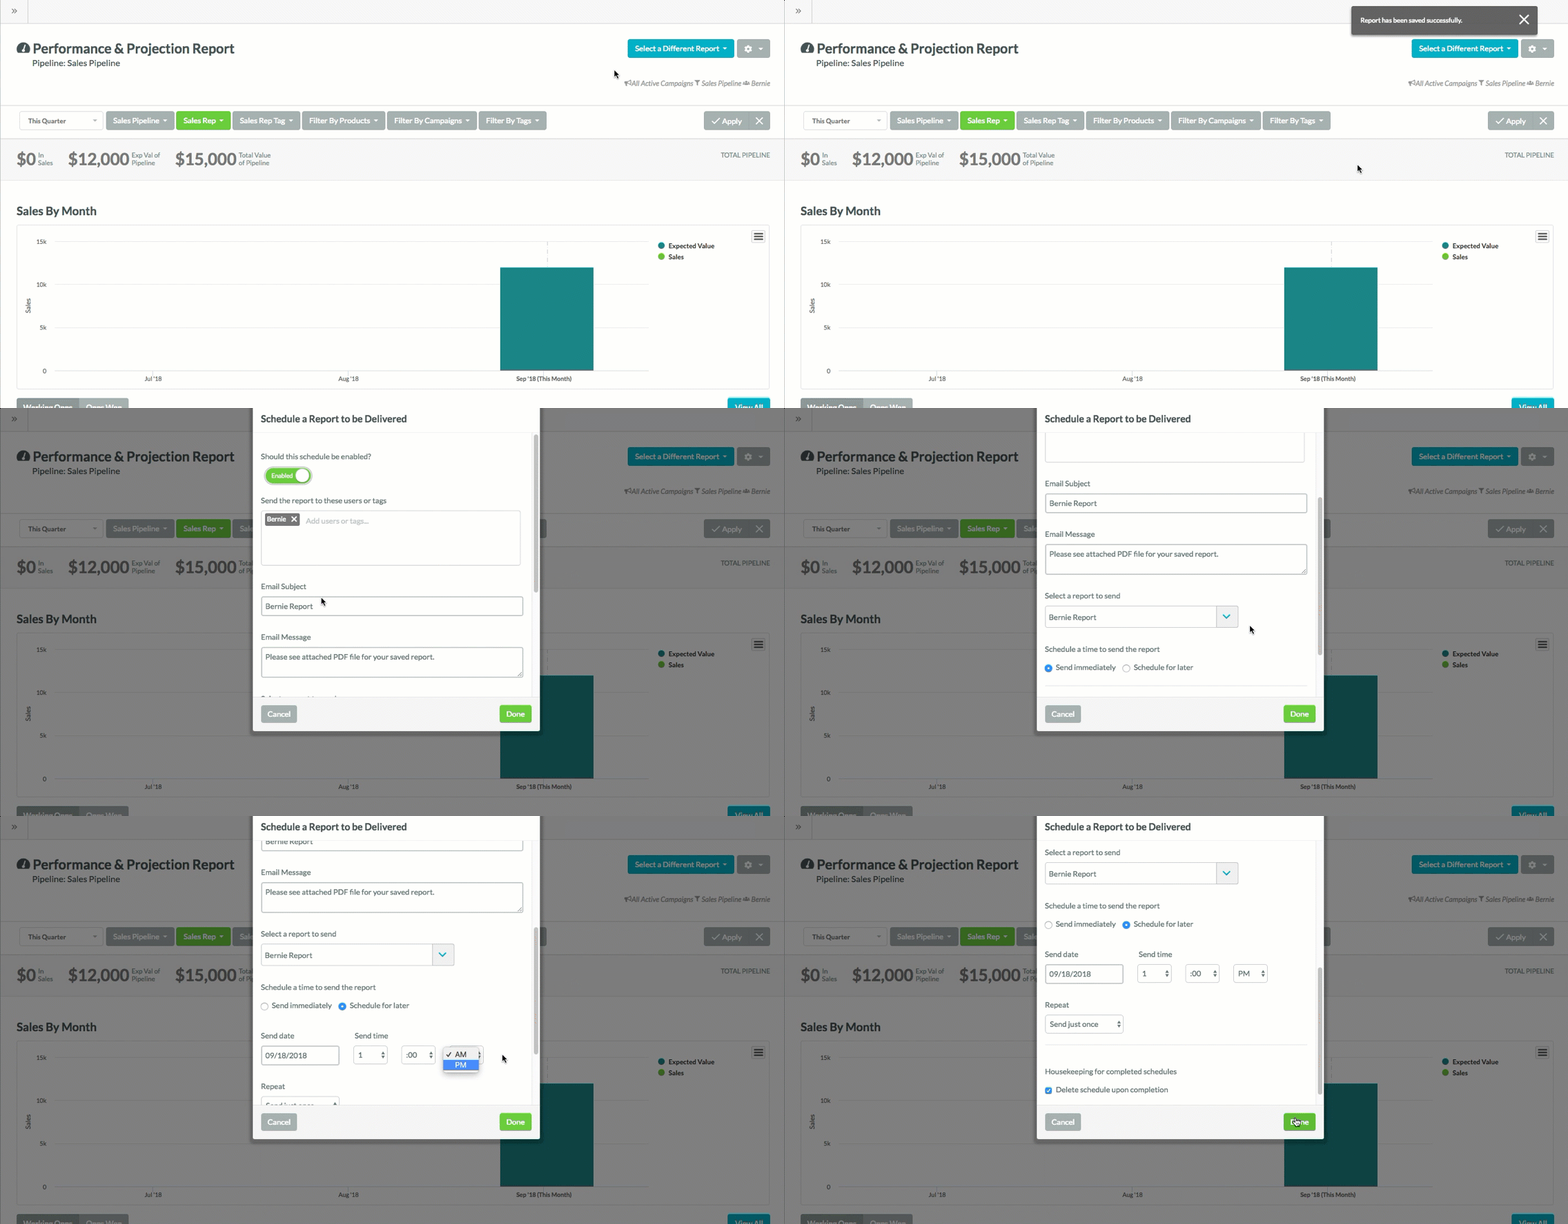
To save a configured Sales Performance report, do the following:
Once saved, you can delete saved Sales Performance reports from the Sales Performance report screen. Be aware that clicking ![]() Options > Delete Report will immediately and irreversibly delete the saved report.
Options > Delete Report will immediately and irreversibly delete the saved report.
Once you navigate away from the report page, the saved report and its associated parameters will be reset to their default states. To locate and access previously saved reports, do the following:
|
|
Once a Sales Performance report has been configured, it can be scheduled to be sent via email. To schedule a Sales Performance report, do the following:

Note: If you have already saved this report, Save and Schedule Report will instead be listed as Schedule Report.
Note: By default, the Select a report to send drop-down menu will display the report you just saved.
Once a Sales Performance report has been configured, it can be exported as a .PDF file. To export a Sales Performance report, do the following:
| Important: Shopping Cart transactions can generate Opportunities; however, Opportunities created from those transactions are not added to the Sales Pipeline at this time. Please accommodate this in your pipeline analysis. |
Different web browsers or .PDF viewing programs have different means of saving, downloading, or printing a .PDF file. Refer to their help documentation for more information.
| Important: Shopping Cart transactions can generate Opportunities; however, Opportunities created from those transactions are not added to the Sales Pipeline at this time. Please accommodate this in your pipeline analysis. |
To download or print the chart as an image, do the following:
Copyright © 2025 · All Rights Reserved · Constant Contact · Privacy Center