Campaigns are any marketing initiative for which you would like to track results. You can create custom reports to track the success of your campaigns. The Conversion Funnel report will let you visualize how your campaigns are performing with regard to your opportunity statuses and the goals you have for your opportunity statuses.
In this article, you’ll learn how to create custom campaign conversion funnel reports.
| Administrators | ✓ | |
| Company Managers | ✓ | |
| Marketing Managers | ✓ | |
| Sales Managers | ✓ | |
| Salespersons | ||
| Jr. Salespersons |
| Tip: Are you looking for information about Constant Contact’s Email and Digital Marketing product? This article is for Constant Contact’s Lead Gen & CRM product. Head on over to the Email and Digital Marketing articles by clicking here. Not sure what the difference is? Read this article. |
When building a conversion funnel, consider the top of the funnel as the first step. Every step thereafter has to be sequential, or the lead or opportunity will not be counted.
Consider the following funnel sequence, in order from the initial goal to the final goal:
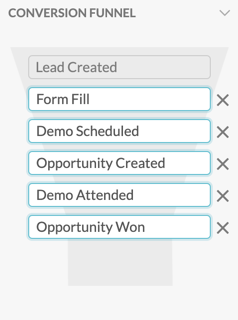
This sequence follows a logical progression. The lead is initially created during the set date. The lead then signs up for a webinar by way of filling out a form. After viewing the webinar, the lead schedules a demonstration. At this point, the lead becomes associated with an open opportunity. The lead then attends the demonstration. Finally, the lead is converted, and the opportunity is changed to closed-won.
If the lead's Life of the Lead follows those events in order they will be included in each step of the funnel. There are, of course, other events that could happen along this lead's particular Life of the Lead, but the funnel is focusing on these six goals. The point of conversion goals is to highlight important events that you want to target and track.
Conversely, if you build a funnel that does not follow a logical, natural progression then the funnel will not function as intended.
Consider an incorrect version of the previous funnel, again in order from the initial goal to the final goal:
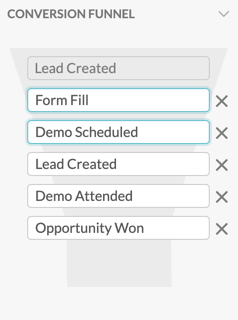
In this funnel, the sequence correctly goes through the lead creation, webinar form, and demonstration scheduling goals. However, the fourth goal would disrupt the funnel entirely. This is due to a few reasons, such as how the lead creation goal was already used. Even if the lead creation goal were not used at the start of the funnel, using it where it is that far down the funnel would disqualify results. The opportunity creation goal is what would be needed between certain events, such as demonstrations, and setting an opportunity as closed-won.
Even one misplaced conversion goal in a funnel will yield inaccurate or incomplete results. Make sure that your conversion funnels follow a logical progression.
For conversion funnel reports, you can display information on certain conversion events. These represent key actions or events that occur during the course of an opportunity's business cycle.
The available default system conversion events are as follows:
| Event | Description | |||
|
Lead Created |
A person you are looking to close an opportunity with is created in your instance. | |||
|
Lead Qualified |
A lead that has met the criteria to be engaged for products or services. | |||
|
Opportunity |
A potential sale that progresses through a funnel is created in your instance. | |||
|
Opportunity |
A sales opportunity that no longer has a chance to result in a sale. | |||
|
Opportunity |
A sales opportunity that has resulted in a successful sale and generated revenue. | |||
|
Revenue |
The income that your business generates from performing different services. |
Campaign attribution information is best displayed through a custom report. This information can be broken down by various metrics, such as conversion goals or attribution methods. To create these reports, you can use various campaign report widgets.
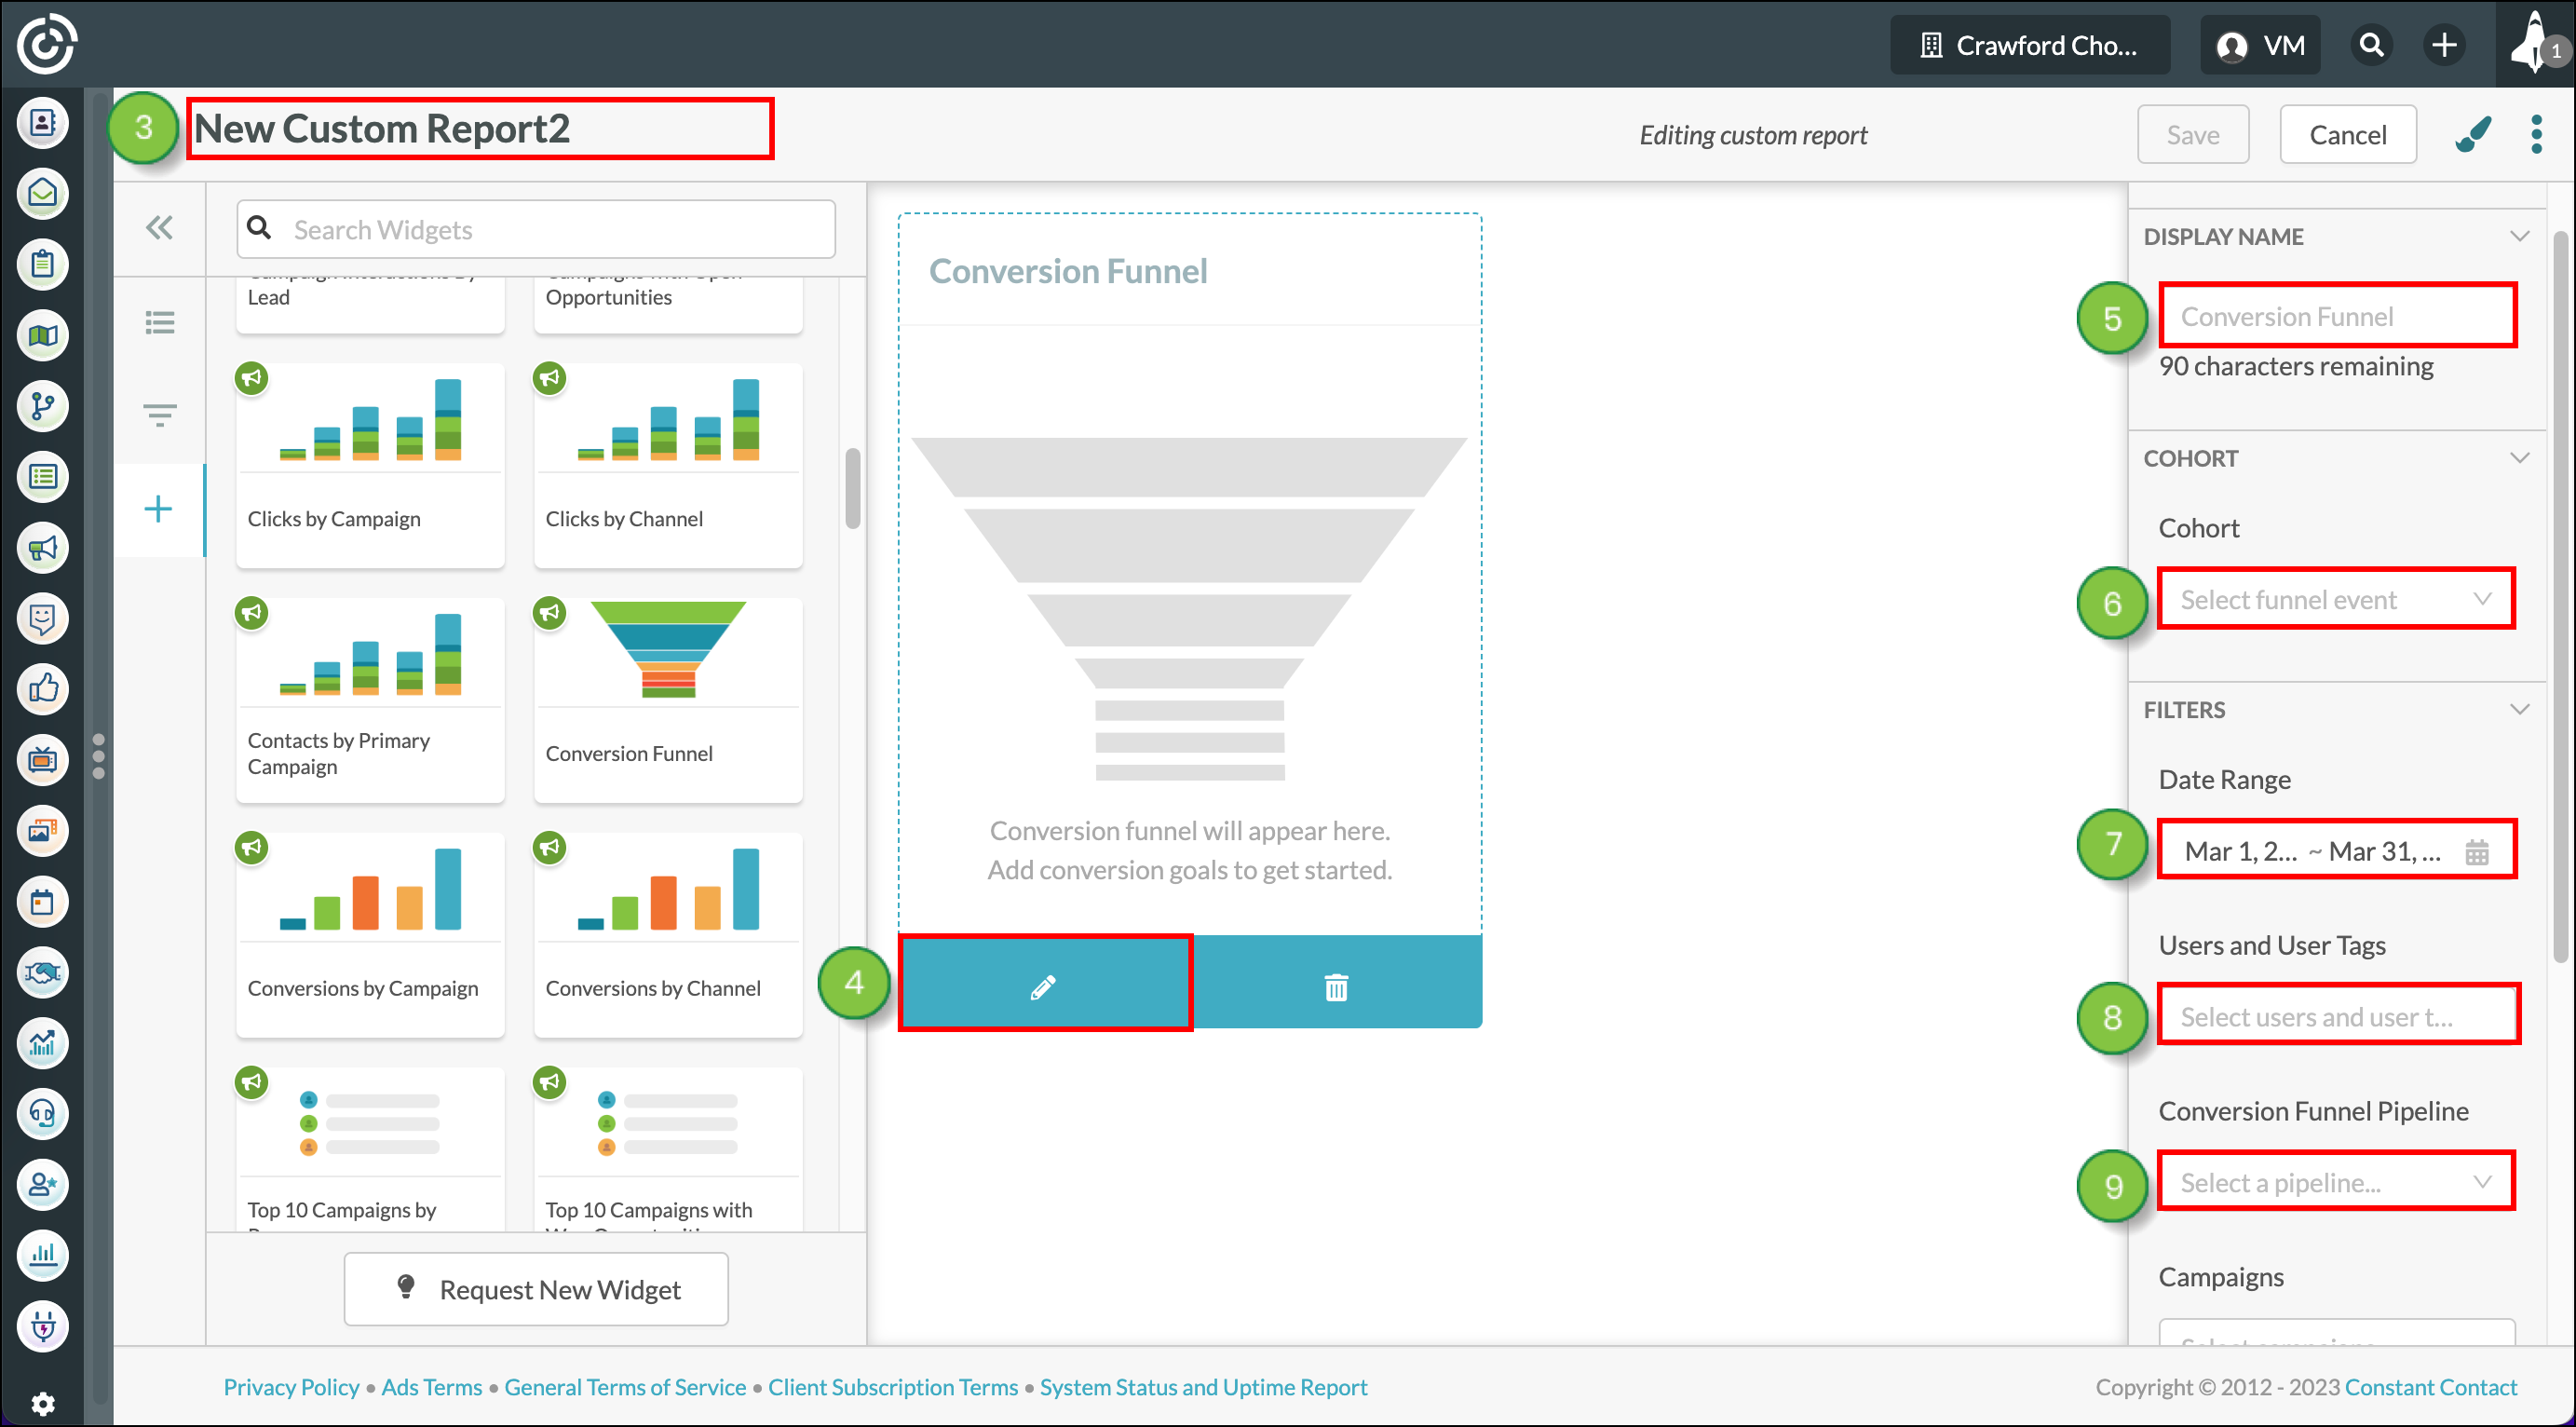
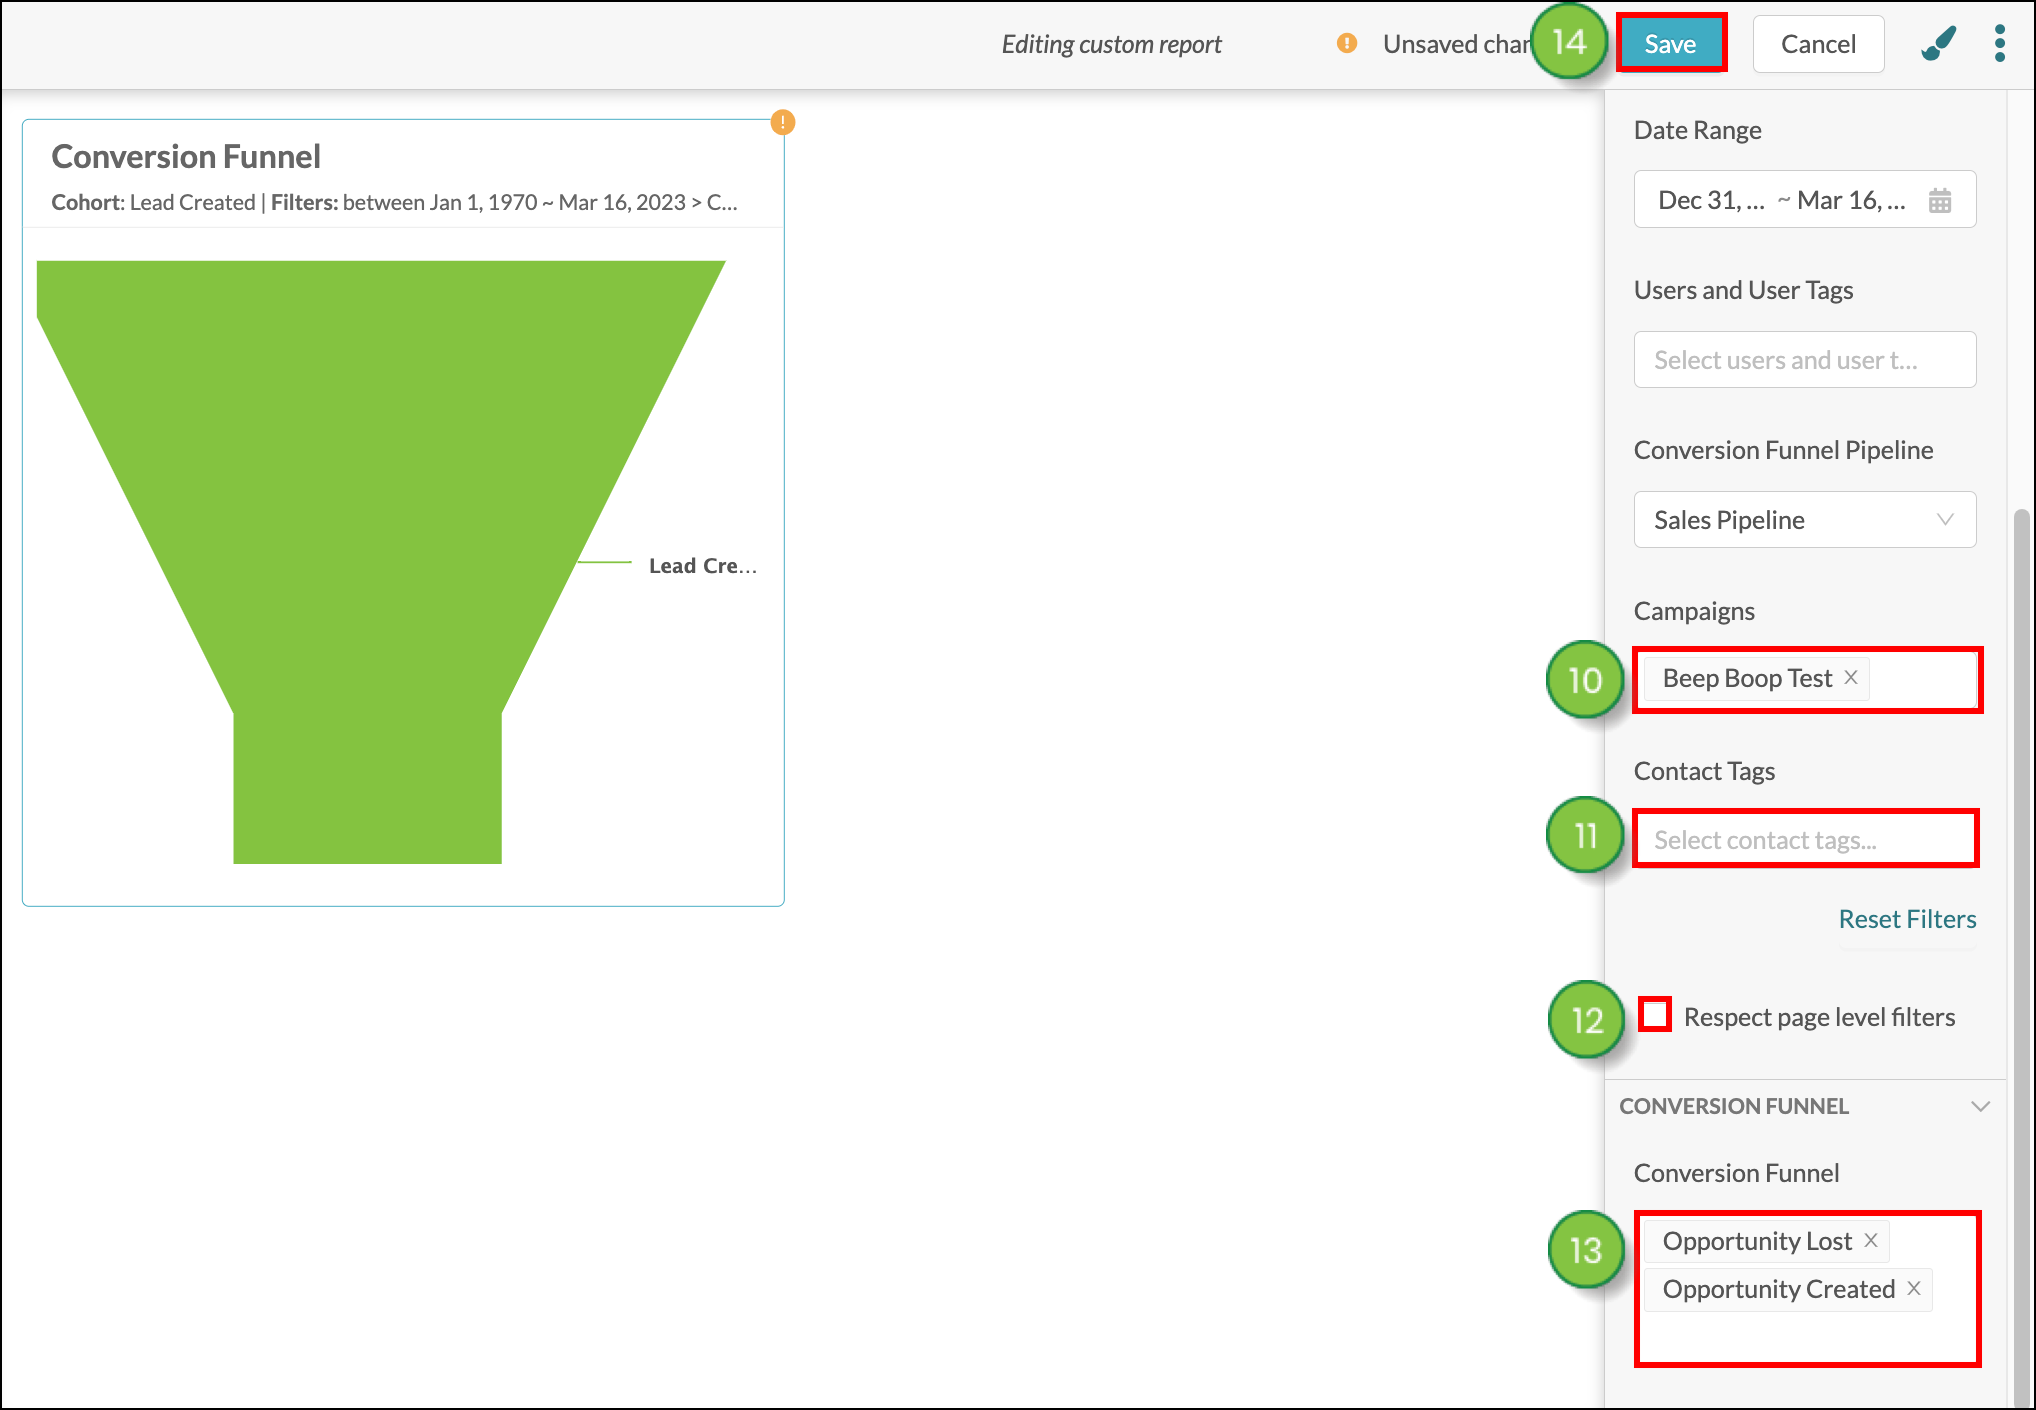
To create campaign attribution reports create a new, or edit an existing, custom report from the Analytics page in the left toolbar.
 Widgets in the toolbar.
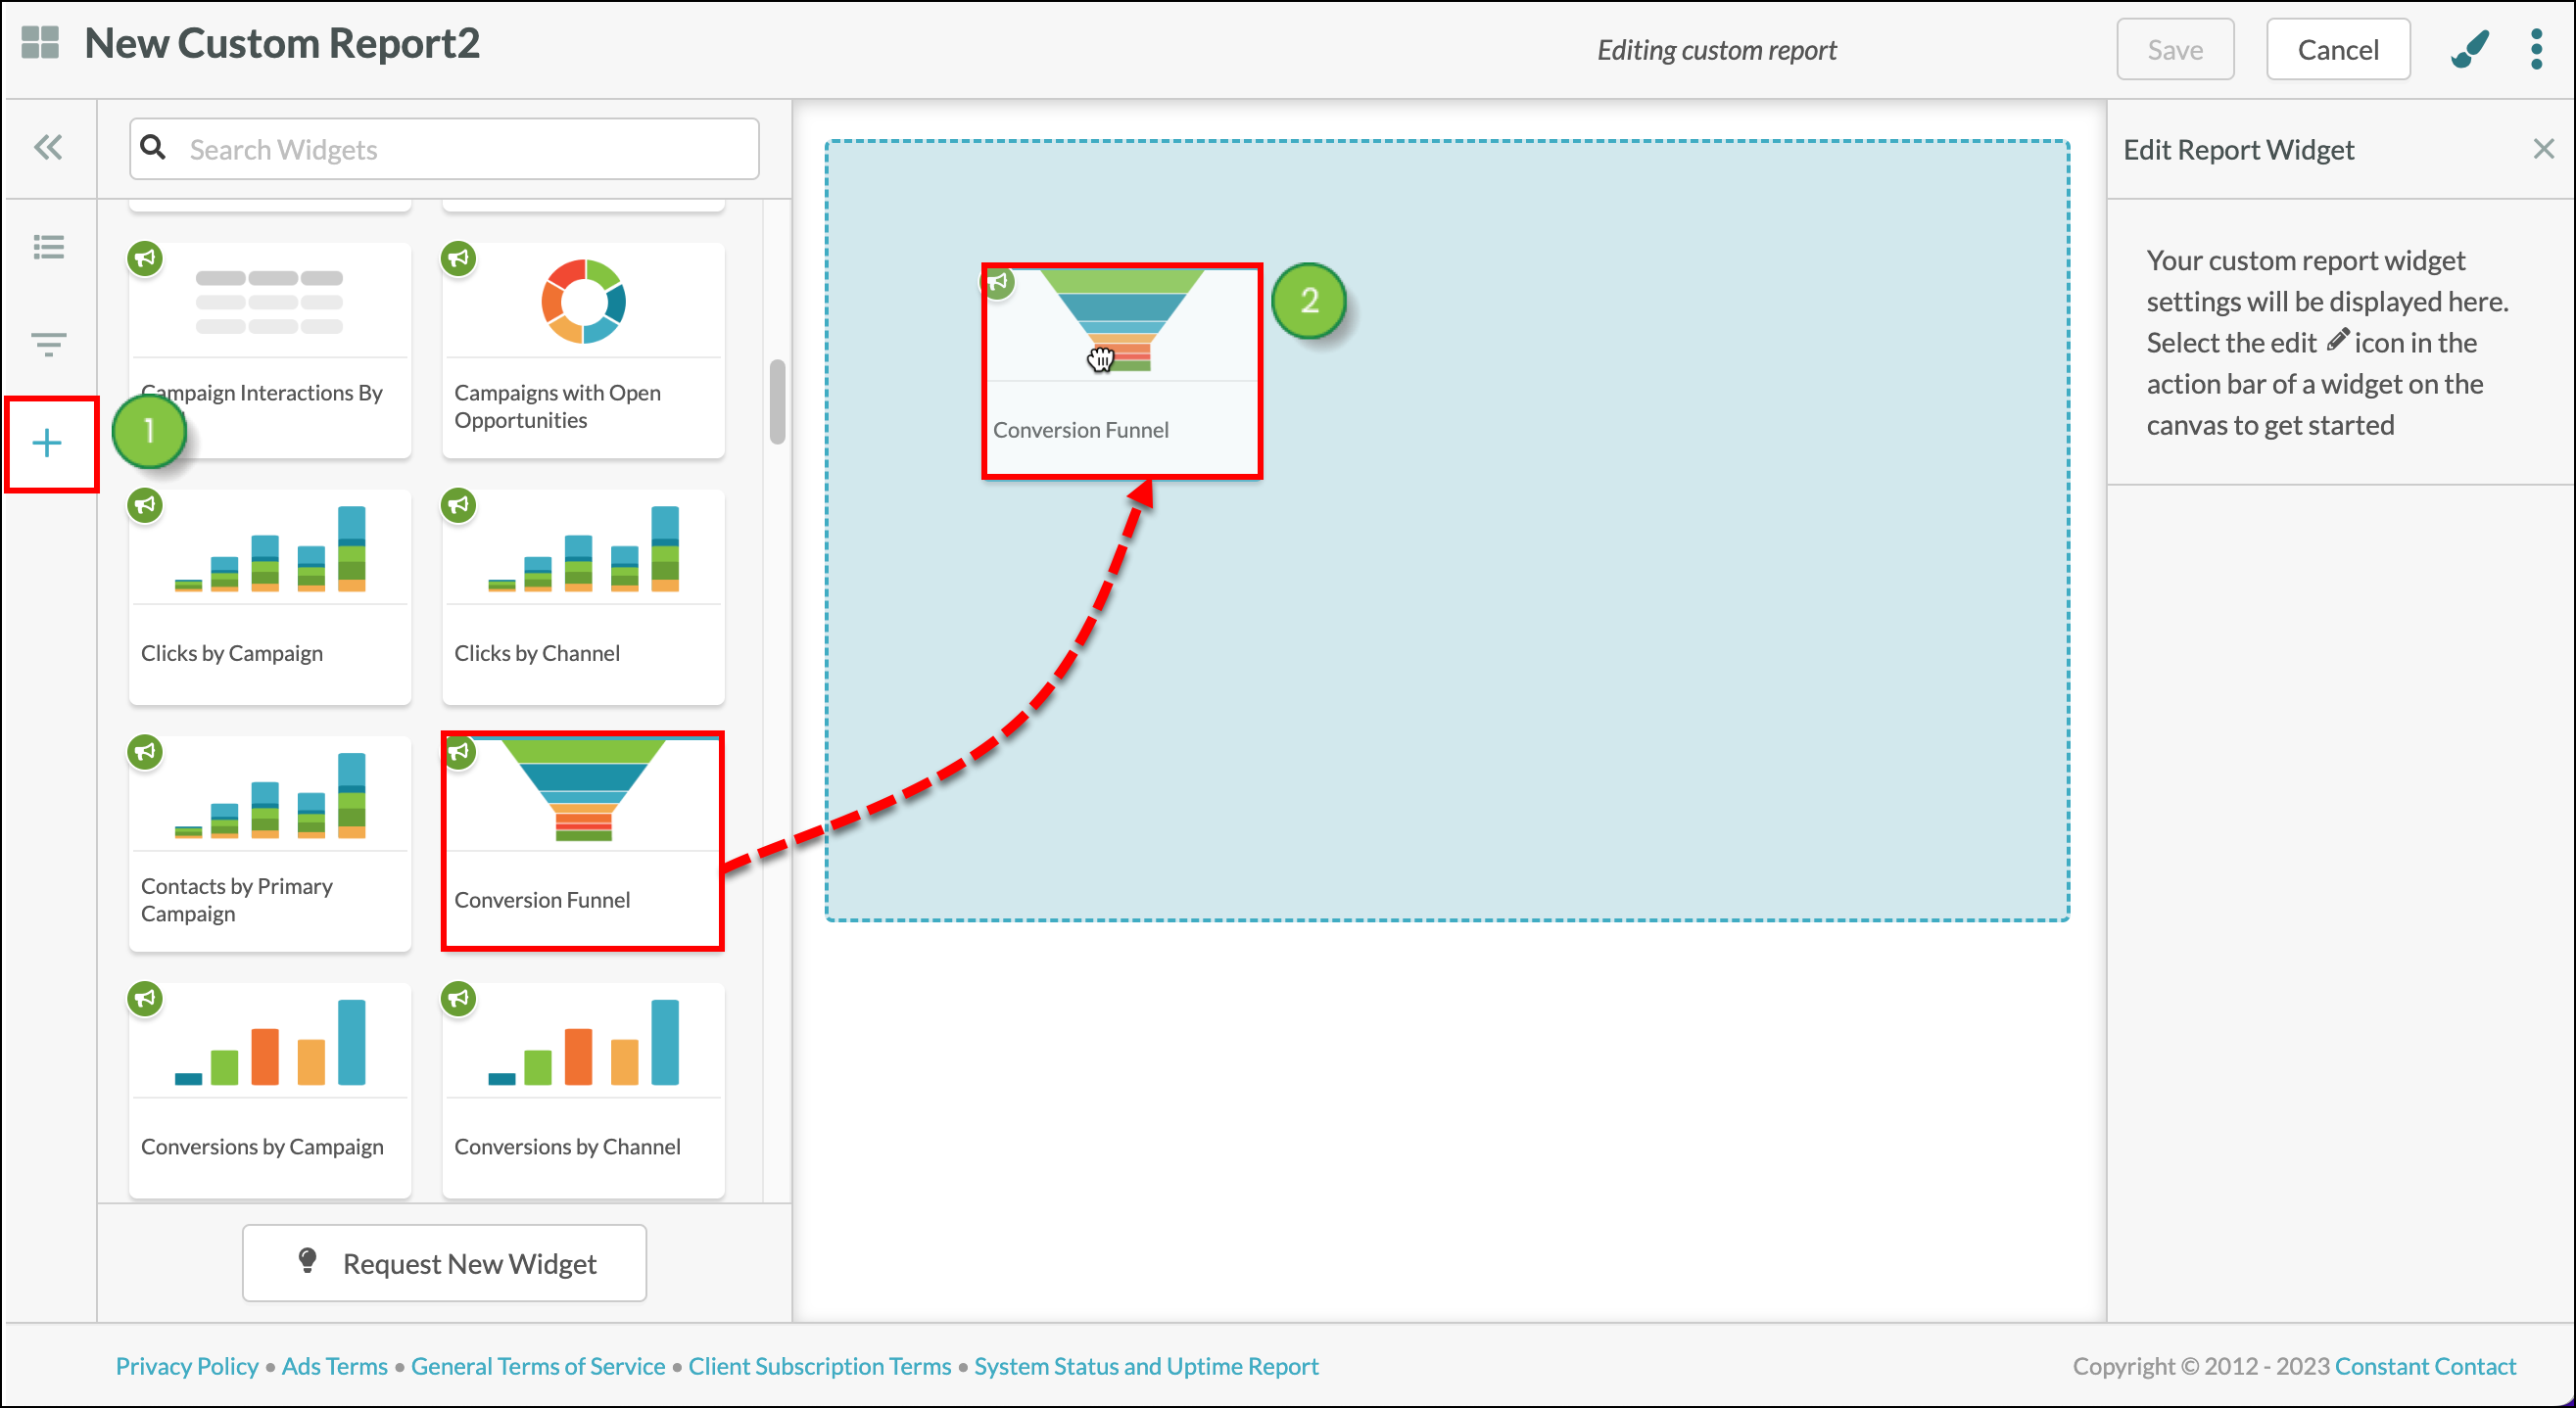
You have options when exporting custom report data. Custom reports can export the entirety of their data, or they can export data from individual widgets.
Once a customized report has been configured and saved, it can be exported as a .PDF file. To export customized reports, ensure that you have a saved customized report and navigate to the Custom Report Editor.
 Saved Reports in the toolbar.
 Options > Export PDF.
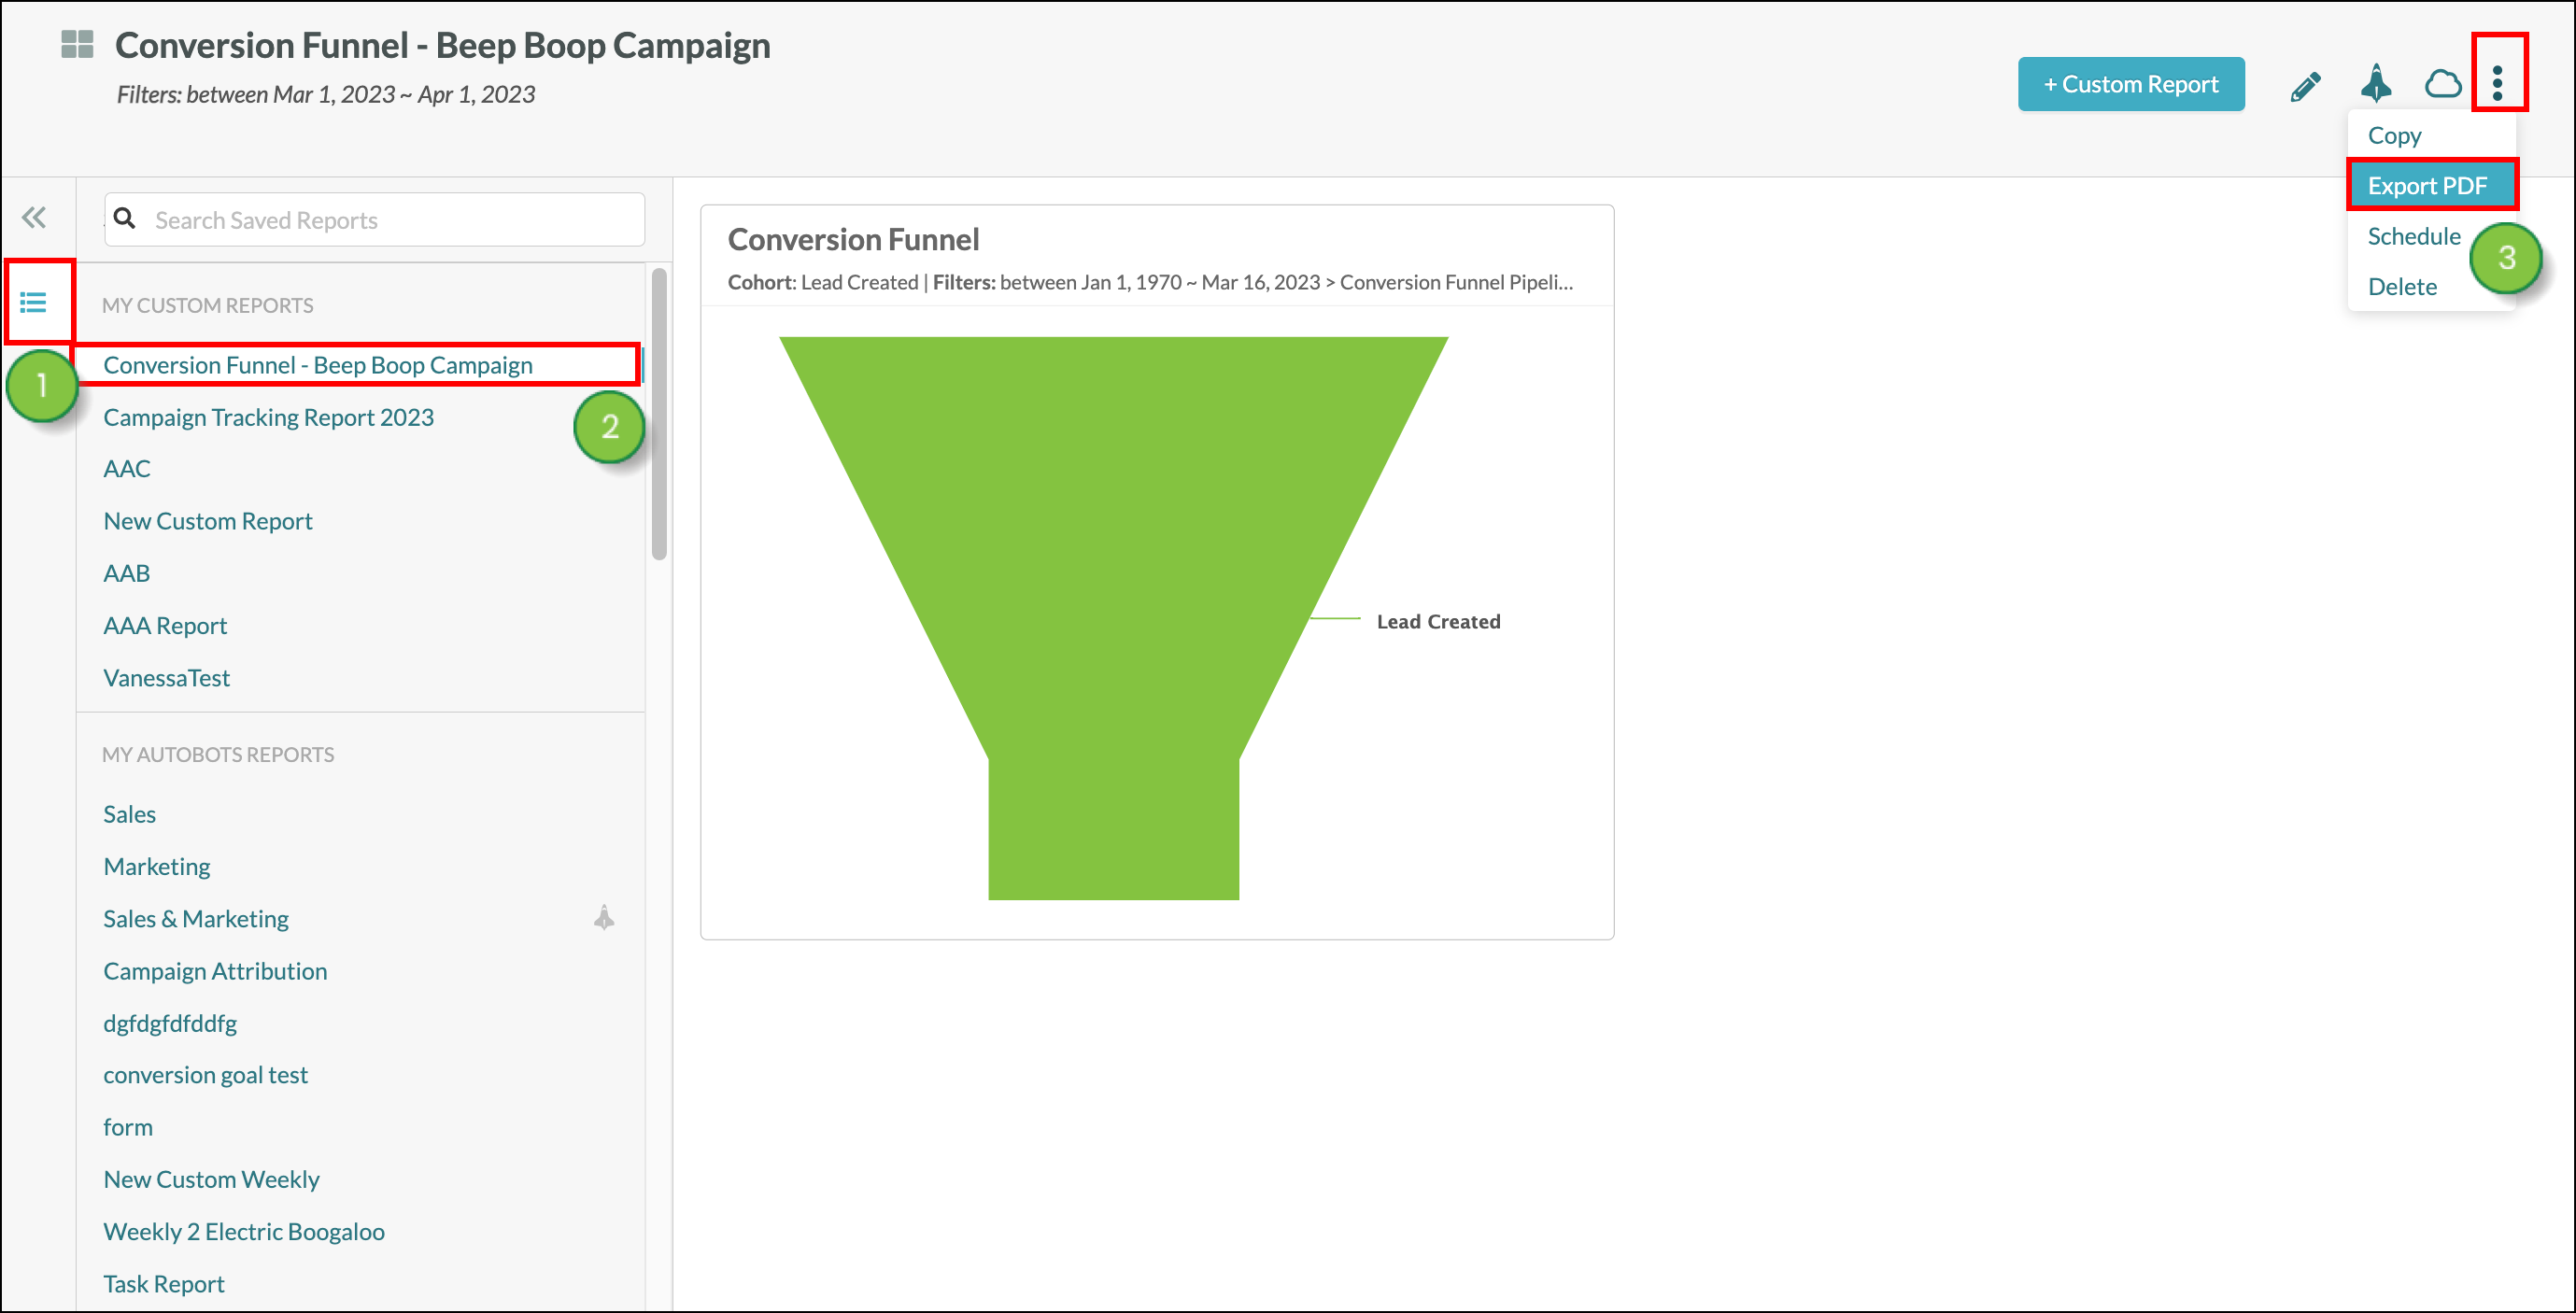
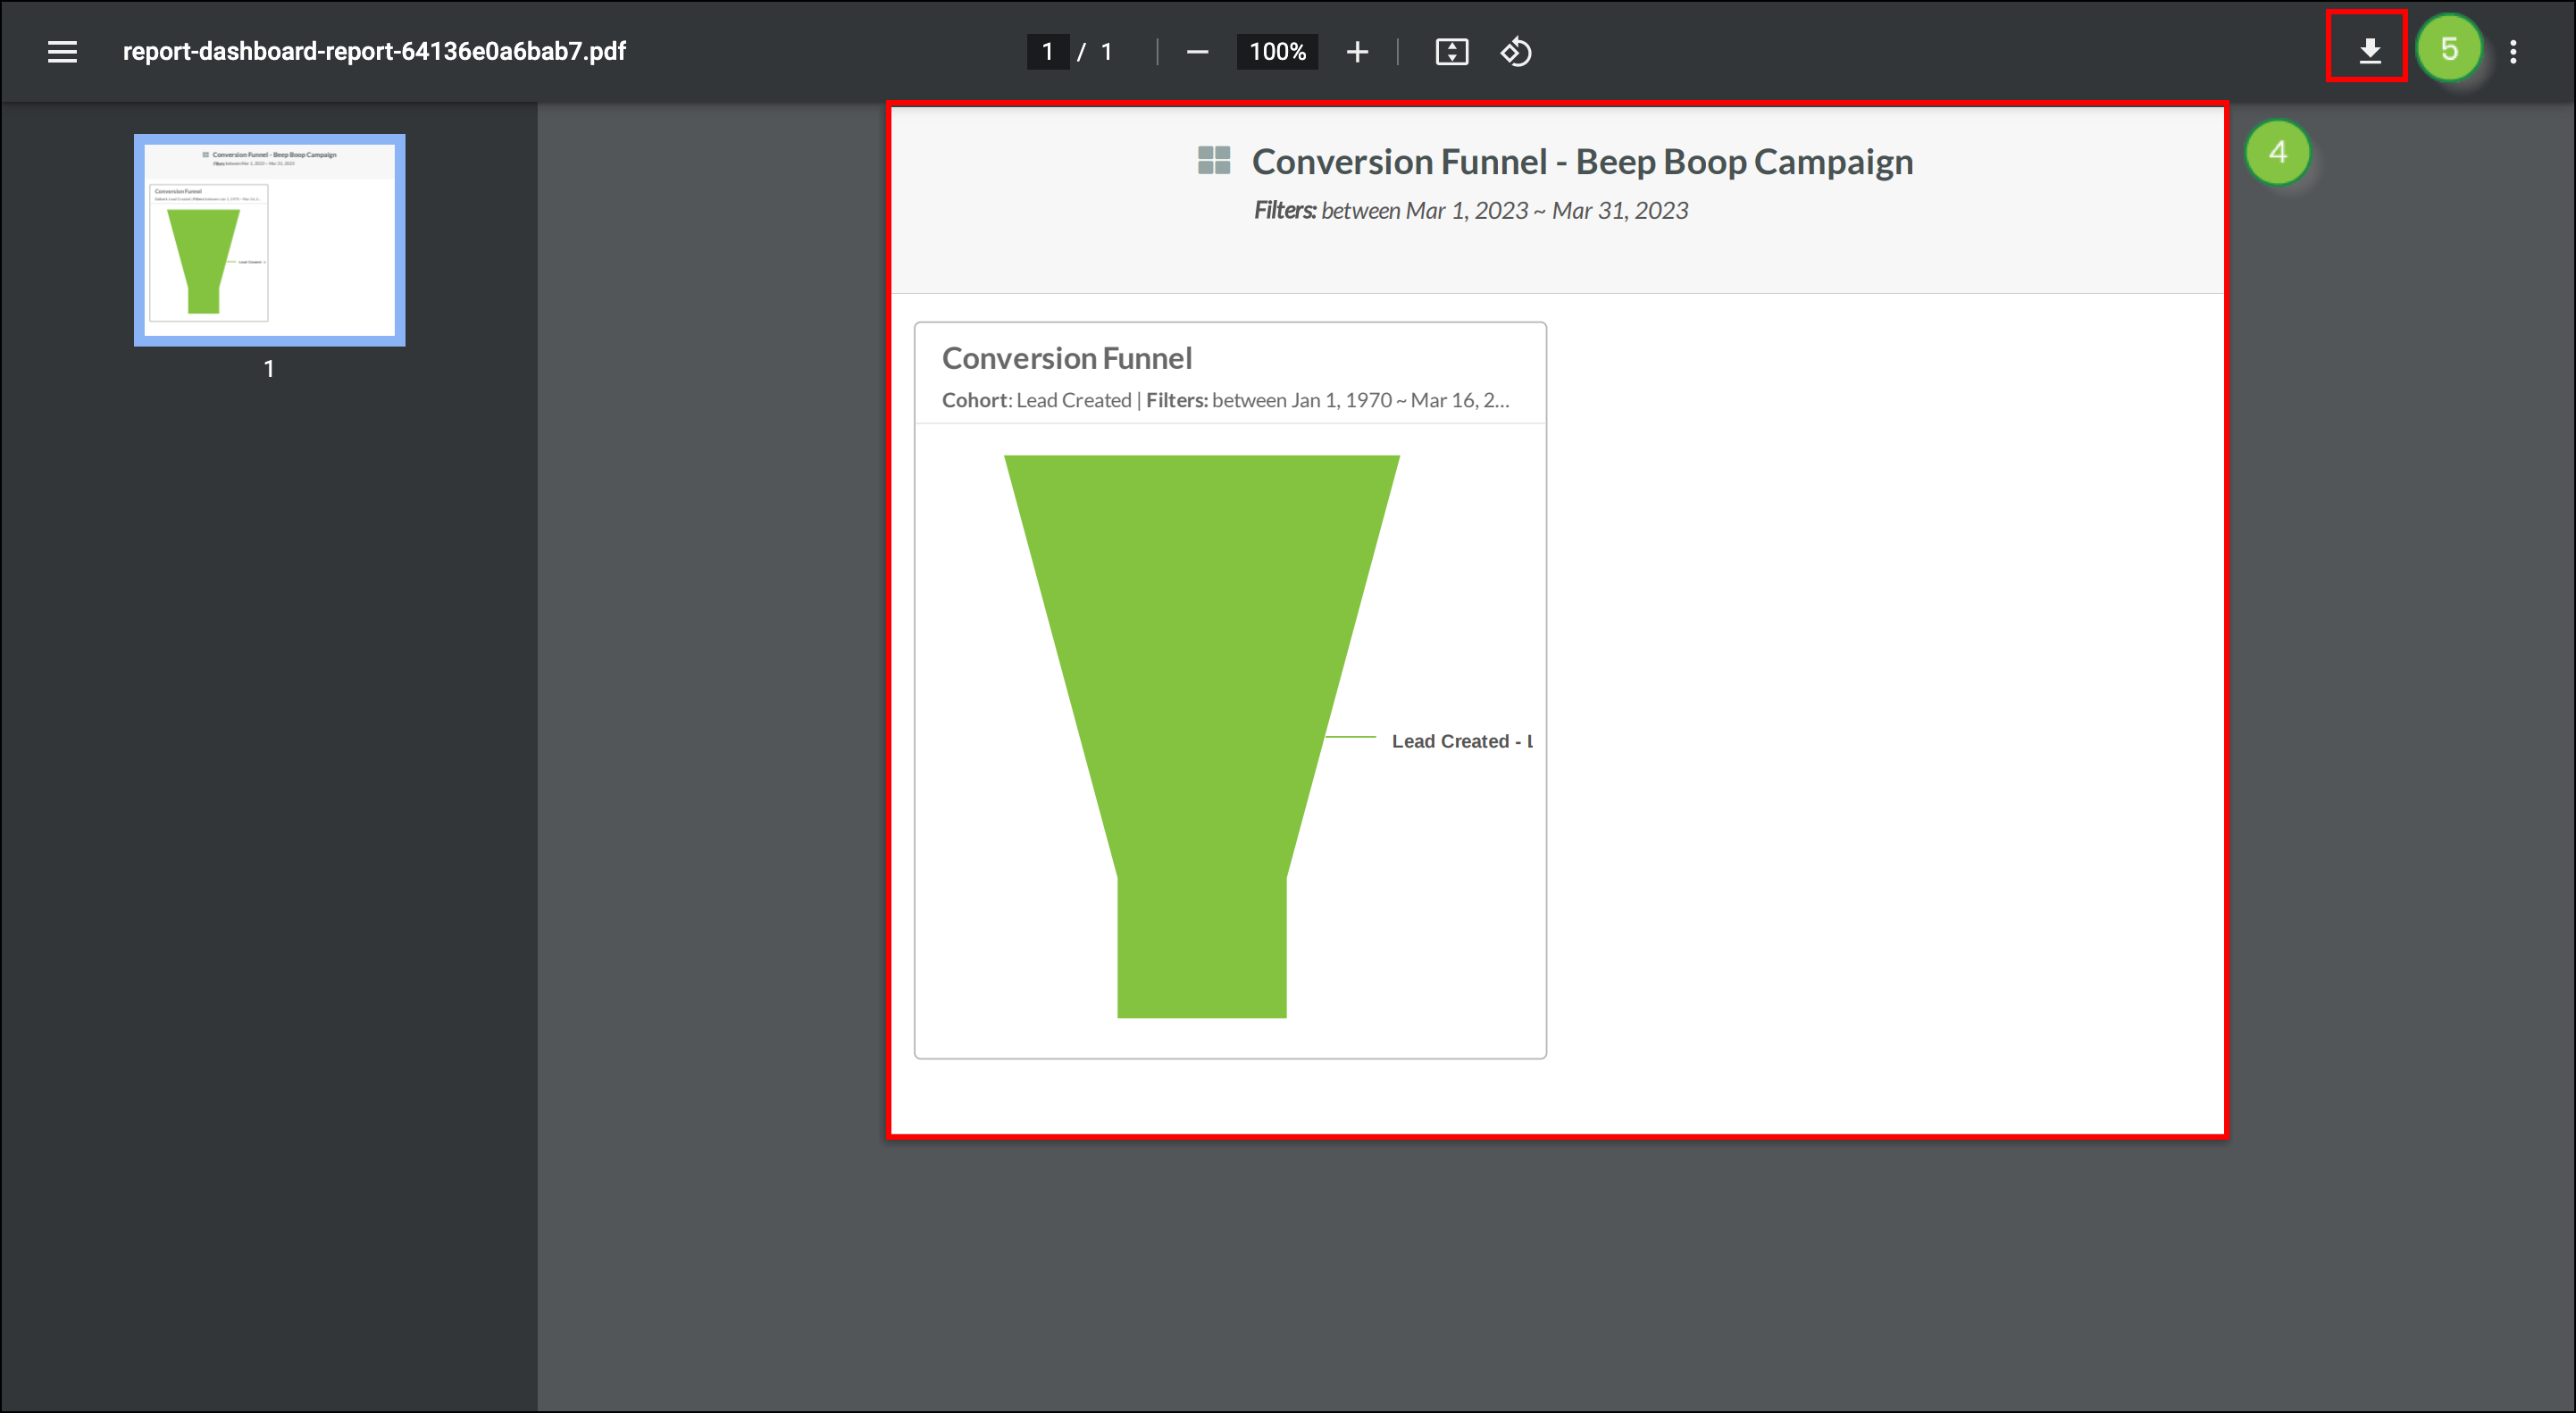
Different web browsers or .PDF viewing programs have different means of saving, downloading, or printing a .PDF file. Refer to their help documentation for more information.
You can export data from individual widgets. Exported data will be saved to your computer as a .CSV file. To export widget data, create or edit a customized report.
Widgets in the toolbar. Options > View.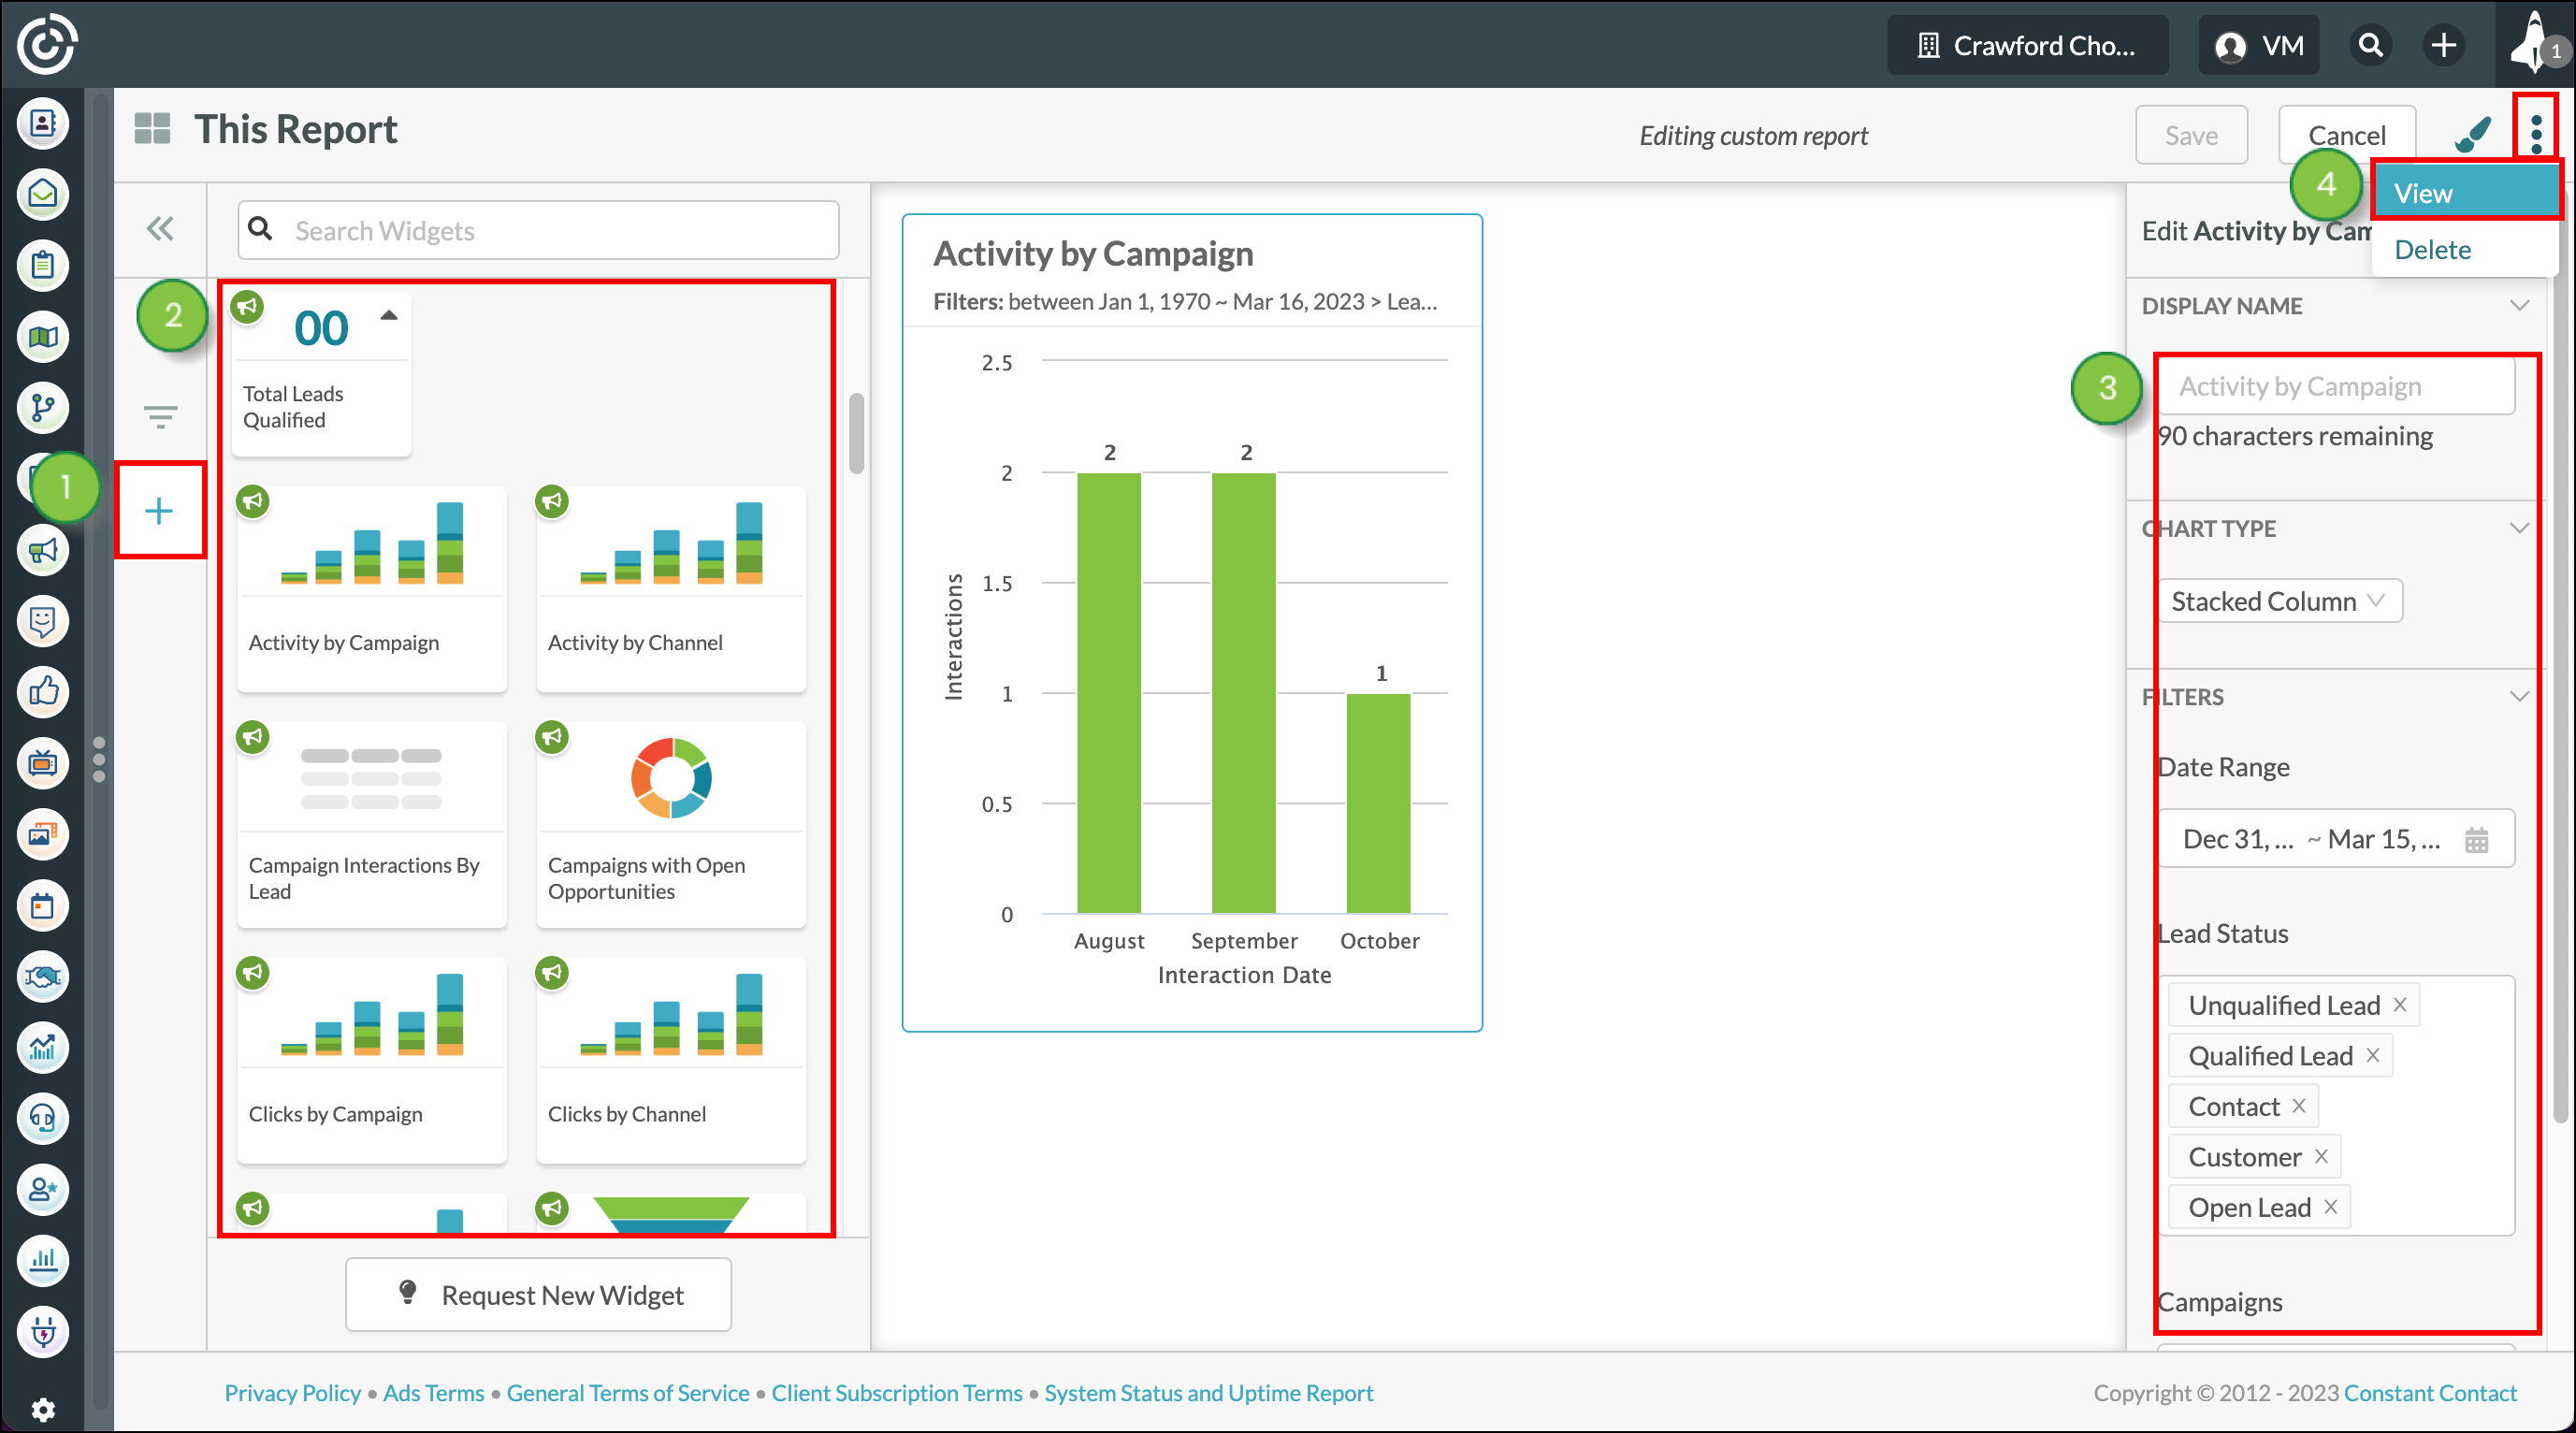
 Export .CSV.
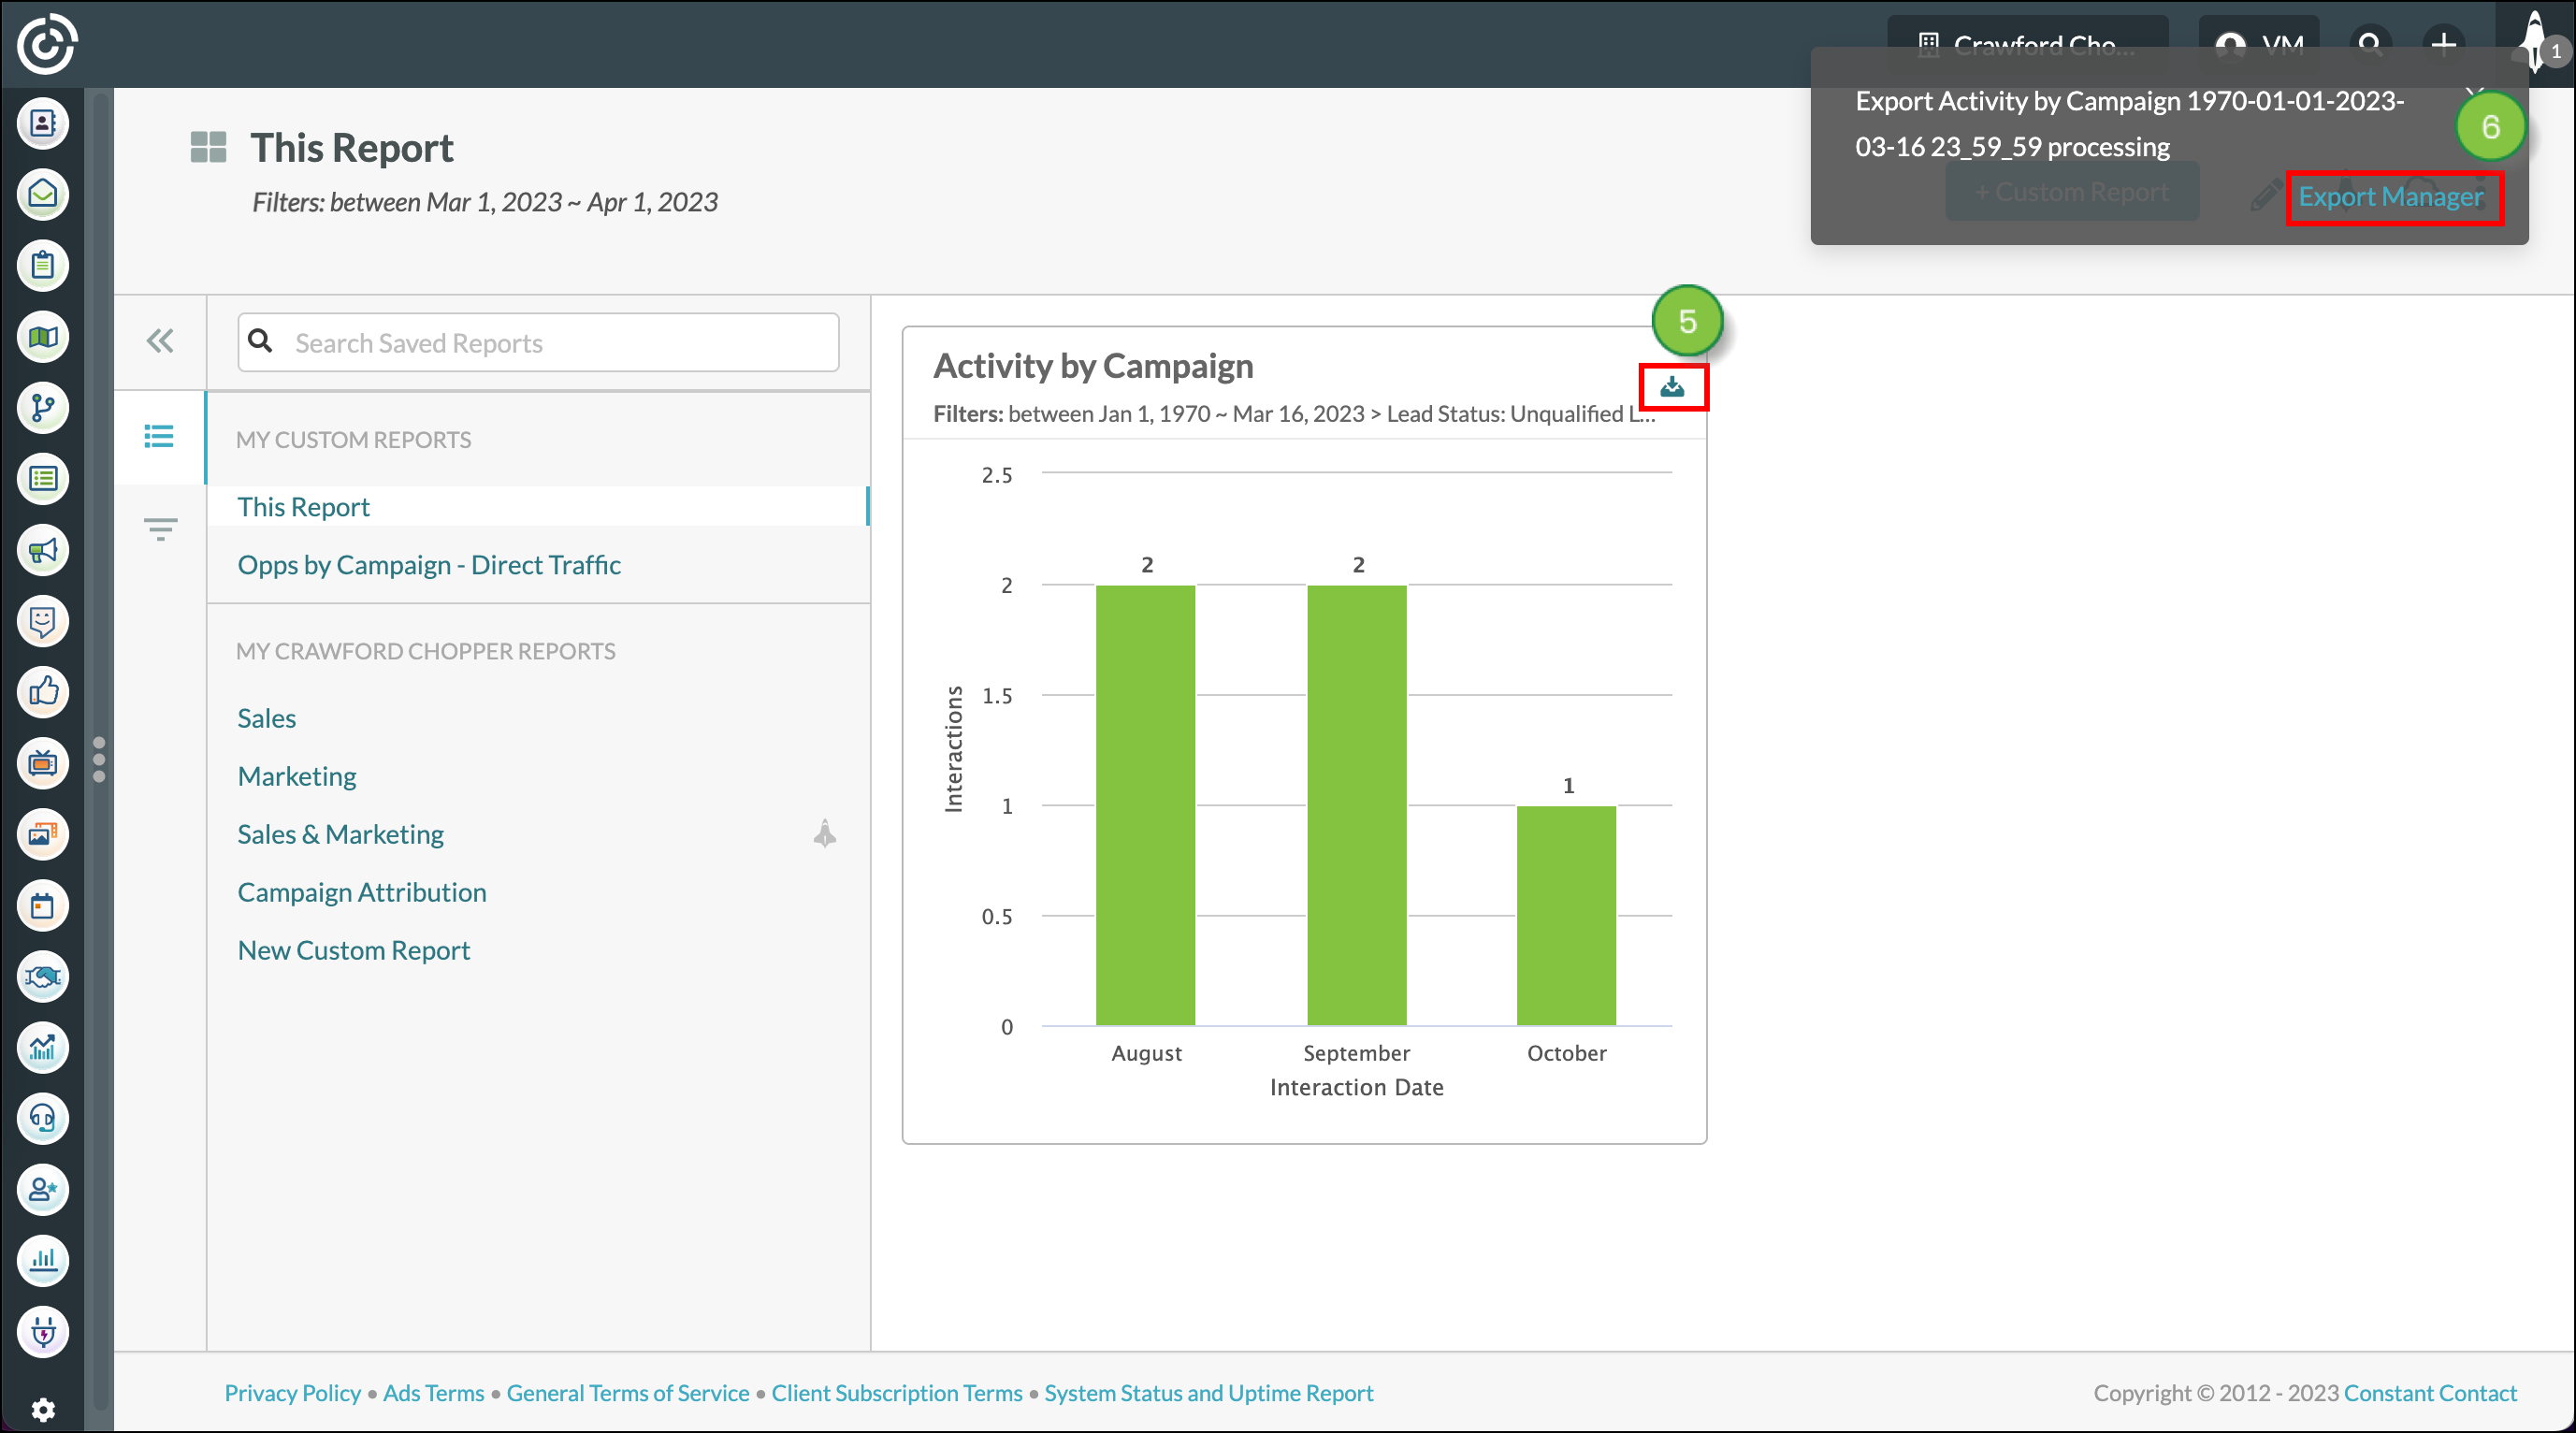
Created reports can be saved to display as individual dashboards on the Launchpad. These then can be set to be what you see when you first log in to Lead Gen & CRM during a given day.
Additionally, you can share your customized dashboards. They are shared through Cloud Dashboards, which are preset displays that are broadcasted to external monitors or televisions. Shared dashboards can be accessed via URLs that are unique for each individual dashboard.
Refer to Launchpad Overview for more information on setting and sharing report dashboards through the Launchpad.
Copyright © 2026 · All Rights Reserved · Constant Contact · Privacy Center