By default, Lead Gen & CRM will attribute the credit for a conversion to a single campaign. However, there are other attribution models for you to choose from that are ideal for multi-touch campaigns. This provides you with a way to distribute attribution of a conversion across several campaigns and to apply models for how that credit is applied.
Multi-touch attribution is beneficial for when a customer interacts with several touch-points in a campaign. For example, if a potential customer sees an ad for your business on social media, later receives a marketing email from you, and finally visits your website directly where they complete a desired action or make a purchase, all touchpoints are owed some credit for the conversion because all interactions likely contributed to whether or not they decided to convert to a customer.
In this article, you’ll learn how to capture that information and use it to create custom campaign attribution reports.
| Administrators | ✓ | |
| Company Managers | ✓ | |
| Marketing Managers | ✓ | |
| Sales Managers | ✓ | |
| Salespersons | ||
| Jr. Salespersons |
| Tip: Are you looking for information about Constant Contact’s Email and Digital Marketing product? This article is for Constant Contact’s Lead Gen & CRM product. Head on over to the Email and Digital Marketing articles by clicking here. Not sure what the difference is? Read this article. |
Campaigns are unique, and as such, the manner in which leads interact with them will also vary greatly. The Conversion by Campaign custom report widget provides several different types of models that let you distribute and record your attribution in various ways.
The available models are as follows:
| Model | Description | Visual | ||
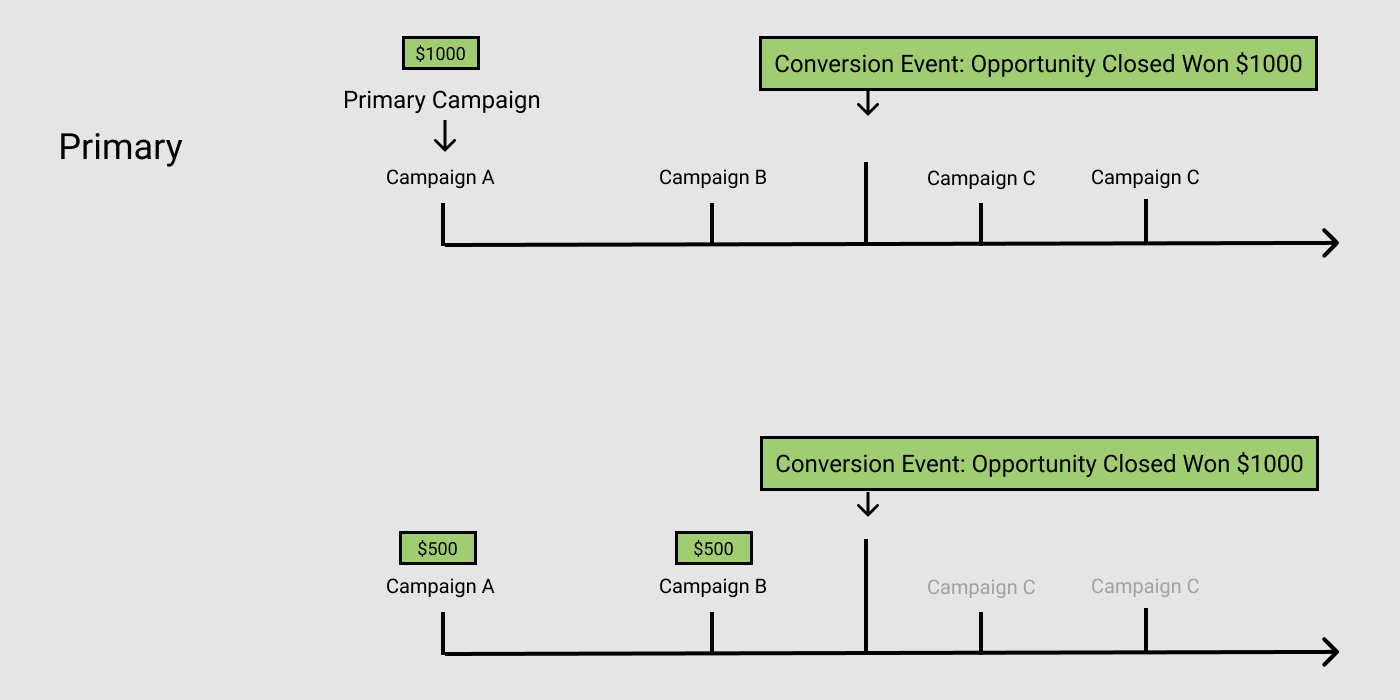
| Primary |
The attribution method of primary campaigns. Be aware that this is a legacy attribution method, and it is set through the Contact Record. |
| ||
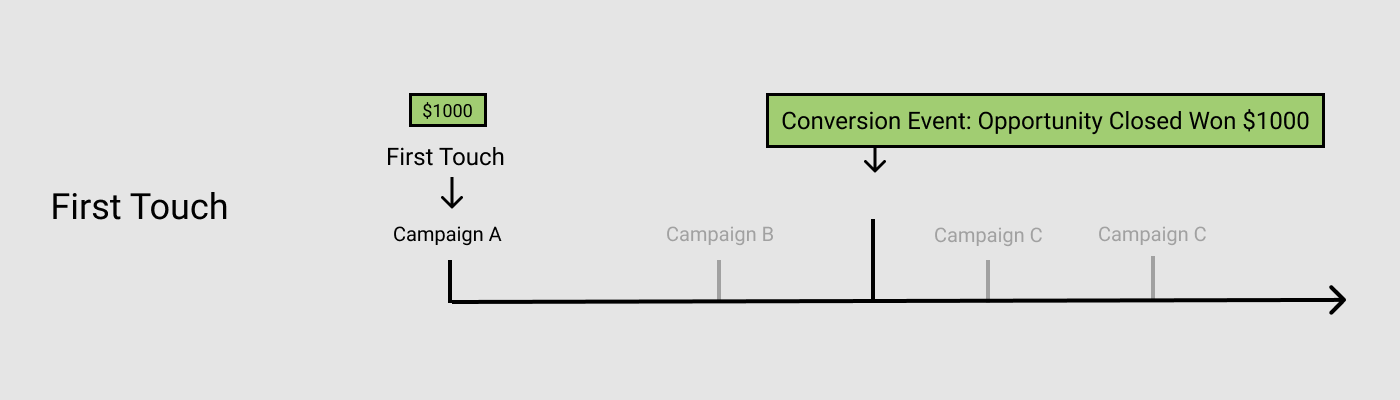
| First Touch |
Gives all attribution to the first campaign interaction within the interaction window. |
| ||
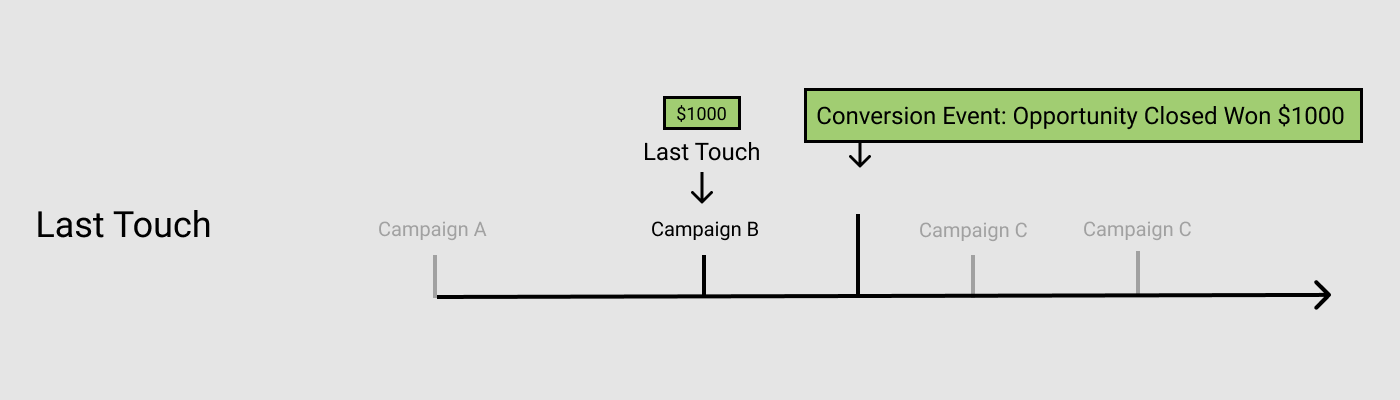
| Last Touch |
Gives all attribution to the last campaign interaction within the interaction window. |
| ||
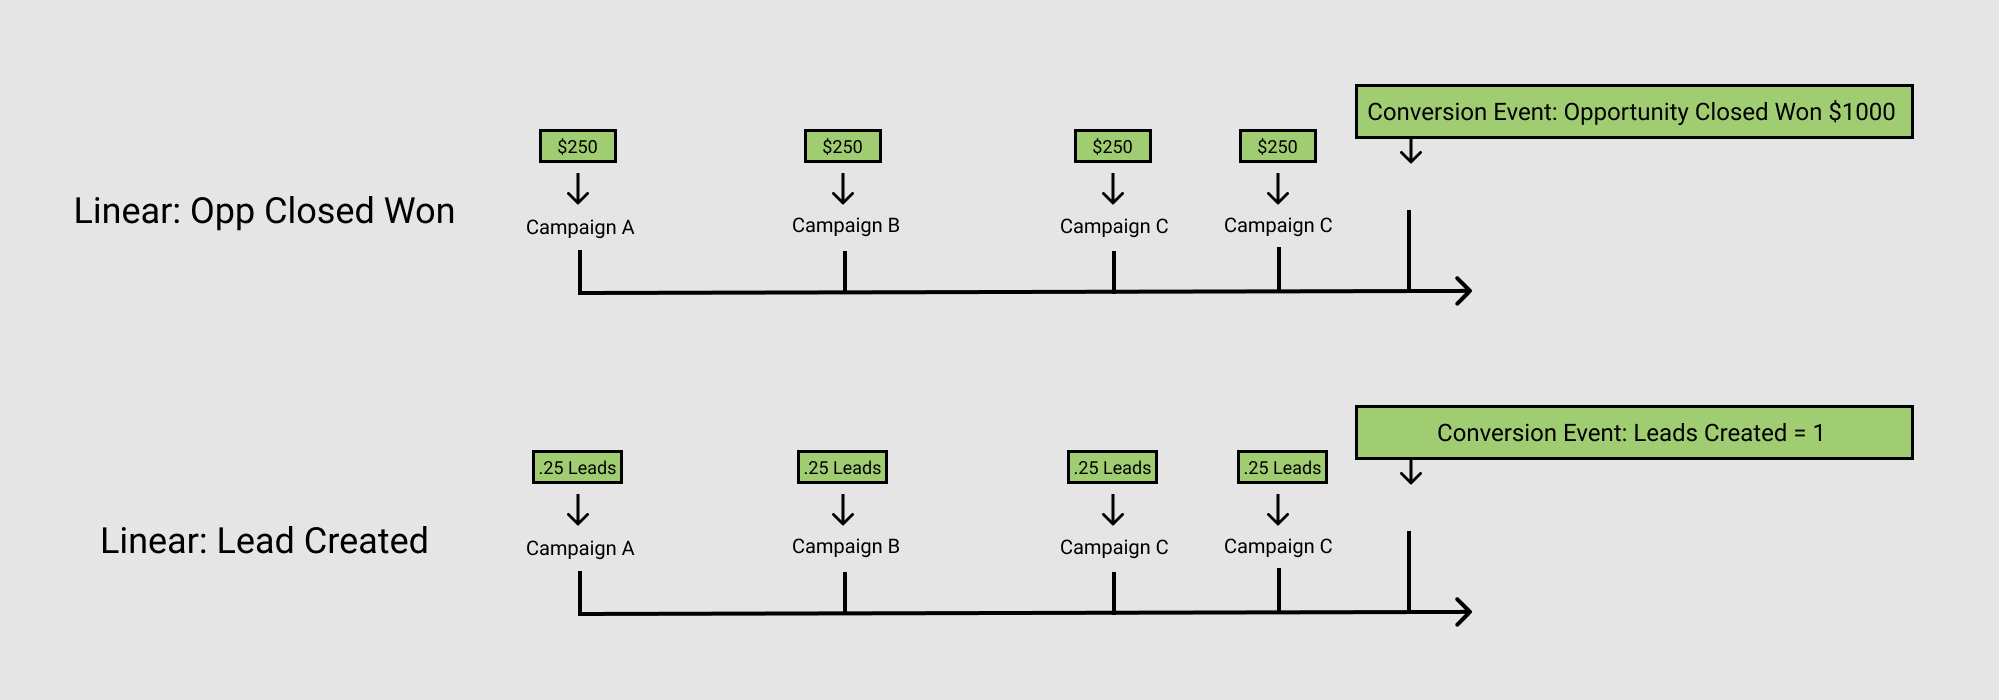
| Linear |
Distributes the attribution equally across all interactions within the interaction window. |
| ||
| Time Decay |
Attributes more value to interactions that occurred more recently. Older interactions will be discounted at an exponential rate, based on the specified time decay length. |
| ||
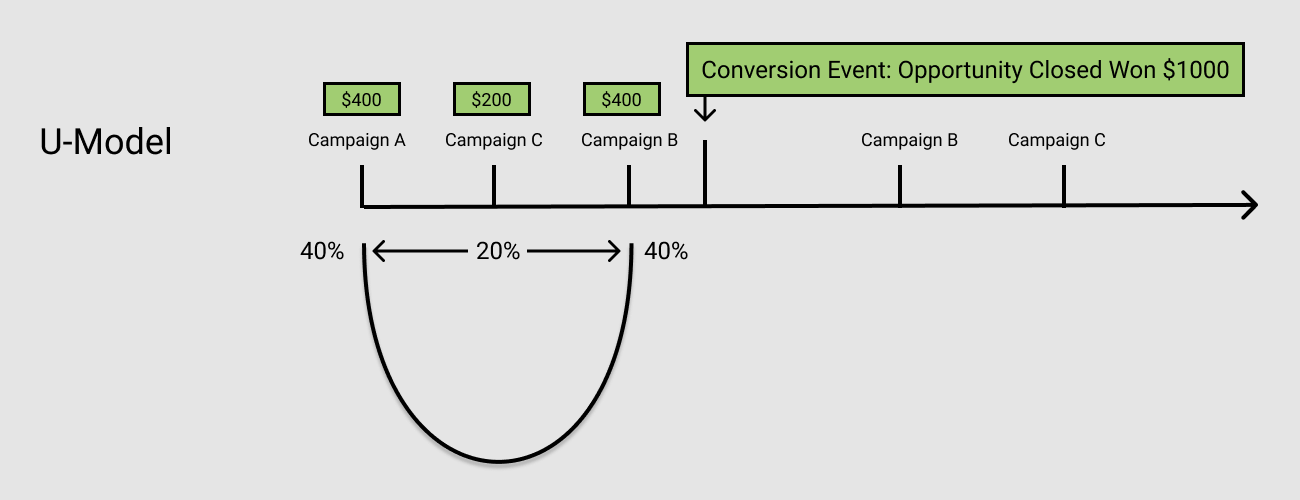
| U-Shaped |
Combines the concepts of First Touch, Last Touch, and Linear. For the U-Shaped model, First Touch and Last Touch interactions are given 40% of the attribution. All remaining credit is distributed evenly across the remaining interactions. |
|
Create a custom report to view and track one or more attribution models.
Campaign attribution information is best displayed through a custom report. This information can be broken down by various metrics, such as conversion goals or attribution methods. To create these reports, you can use various campaign report widgets.
To build campaign attribution reports create a new, or edit an existing, custom report from the Analytics page in the left toolbar.
 Widgets in the toolbar.
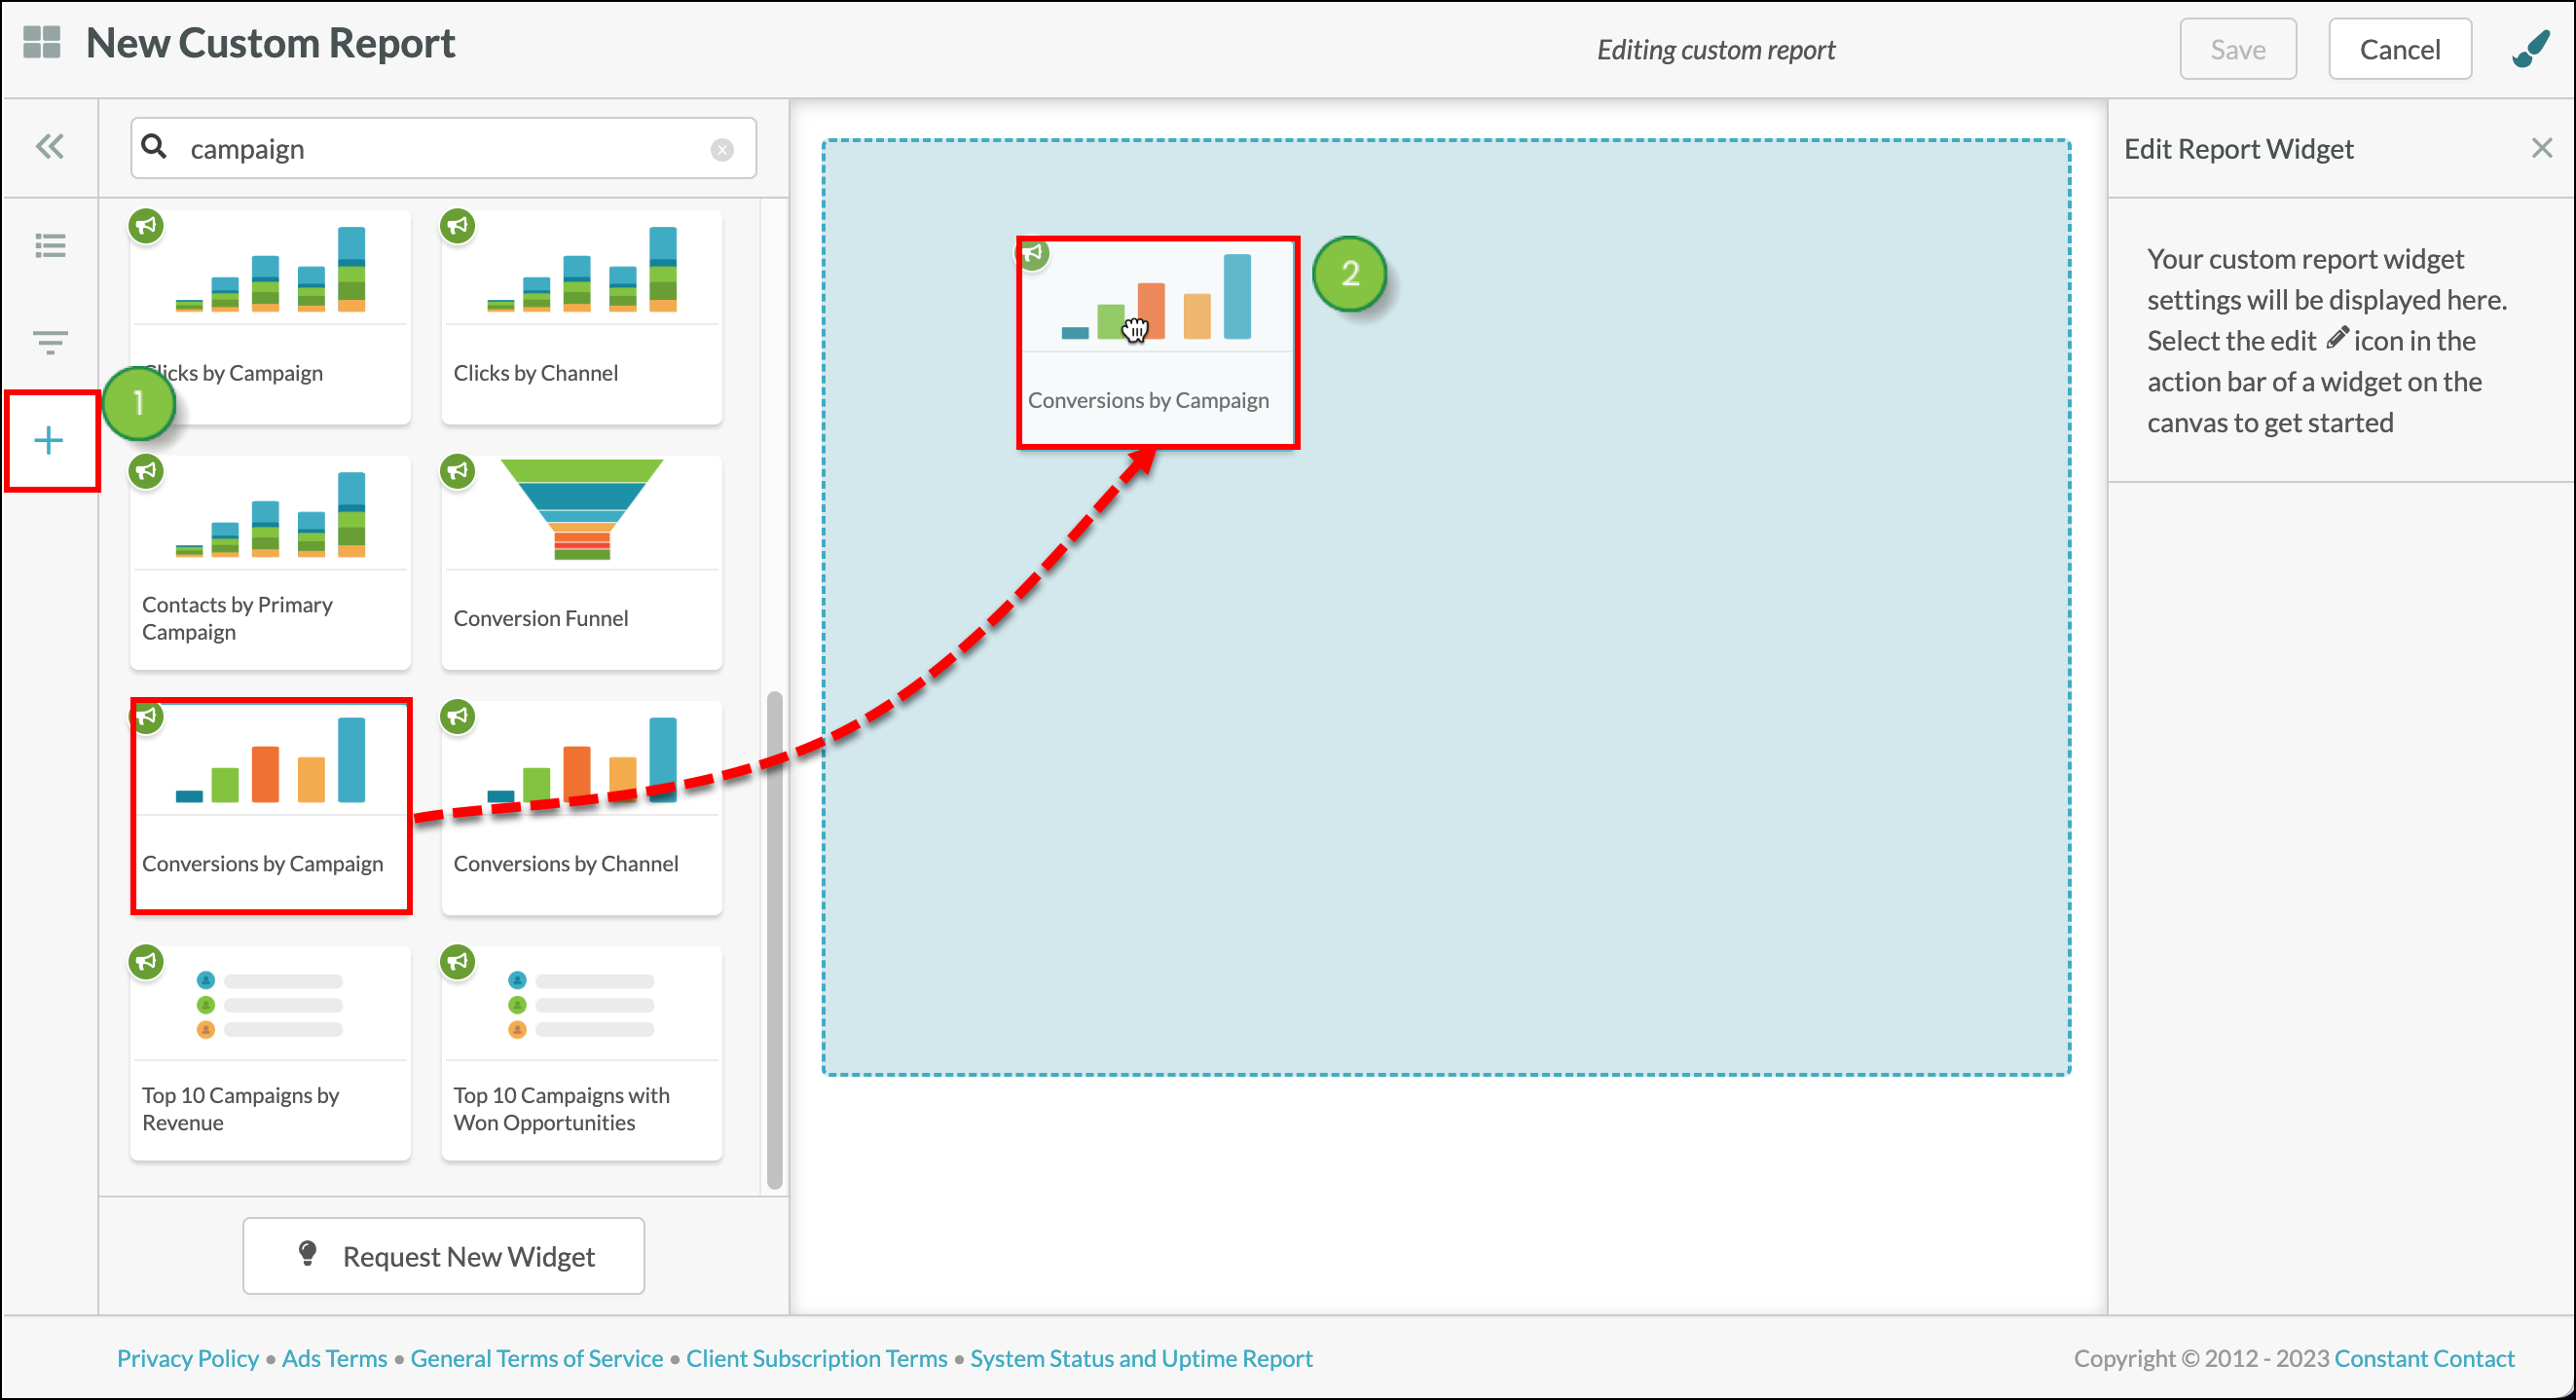
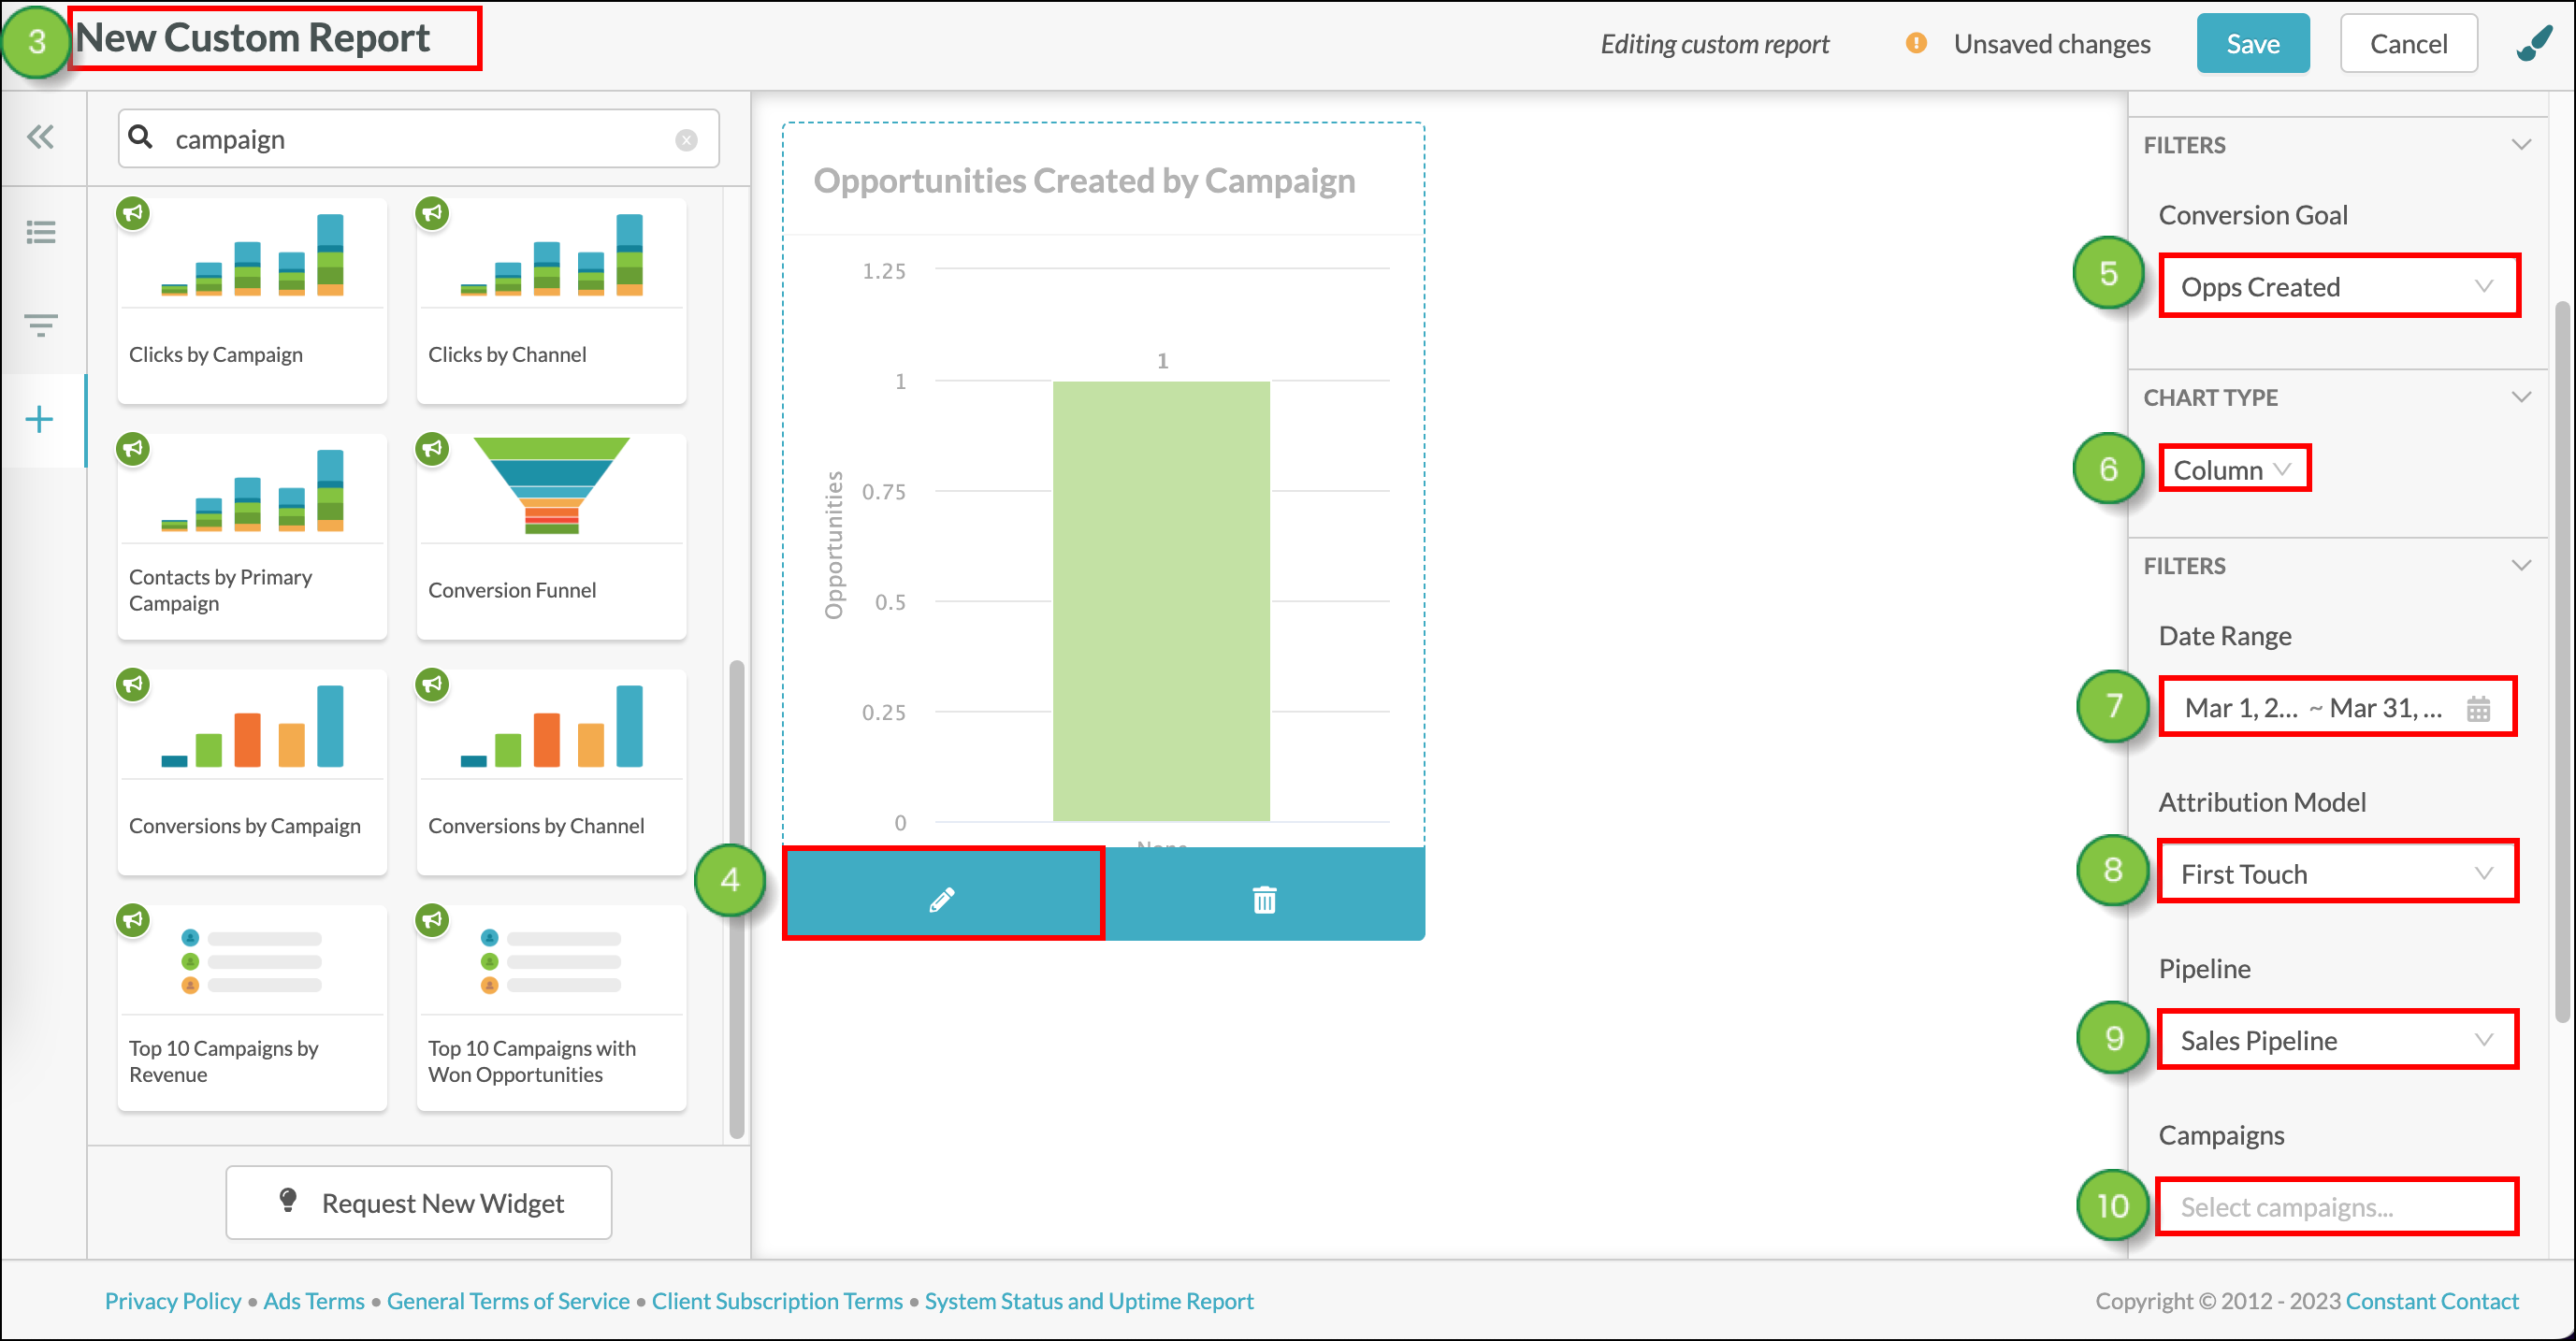
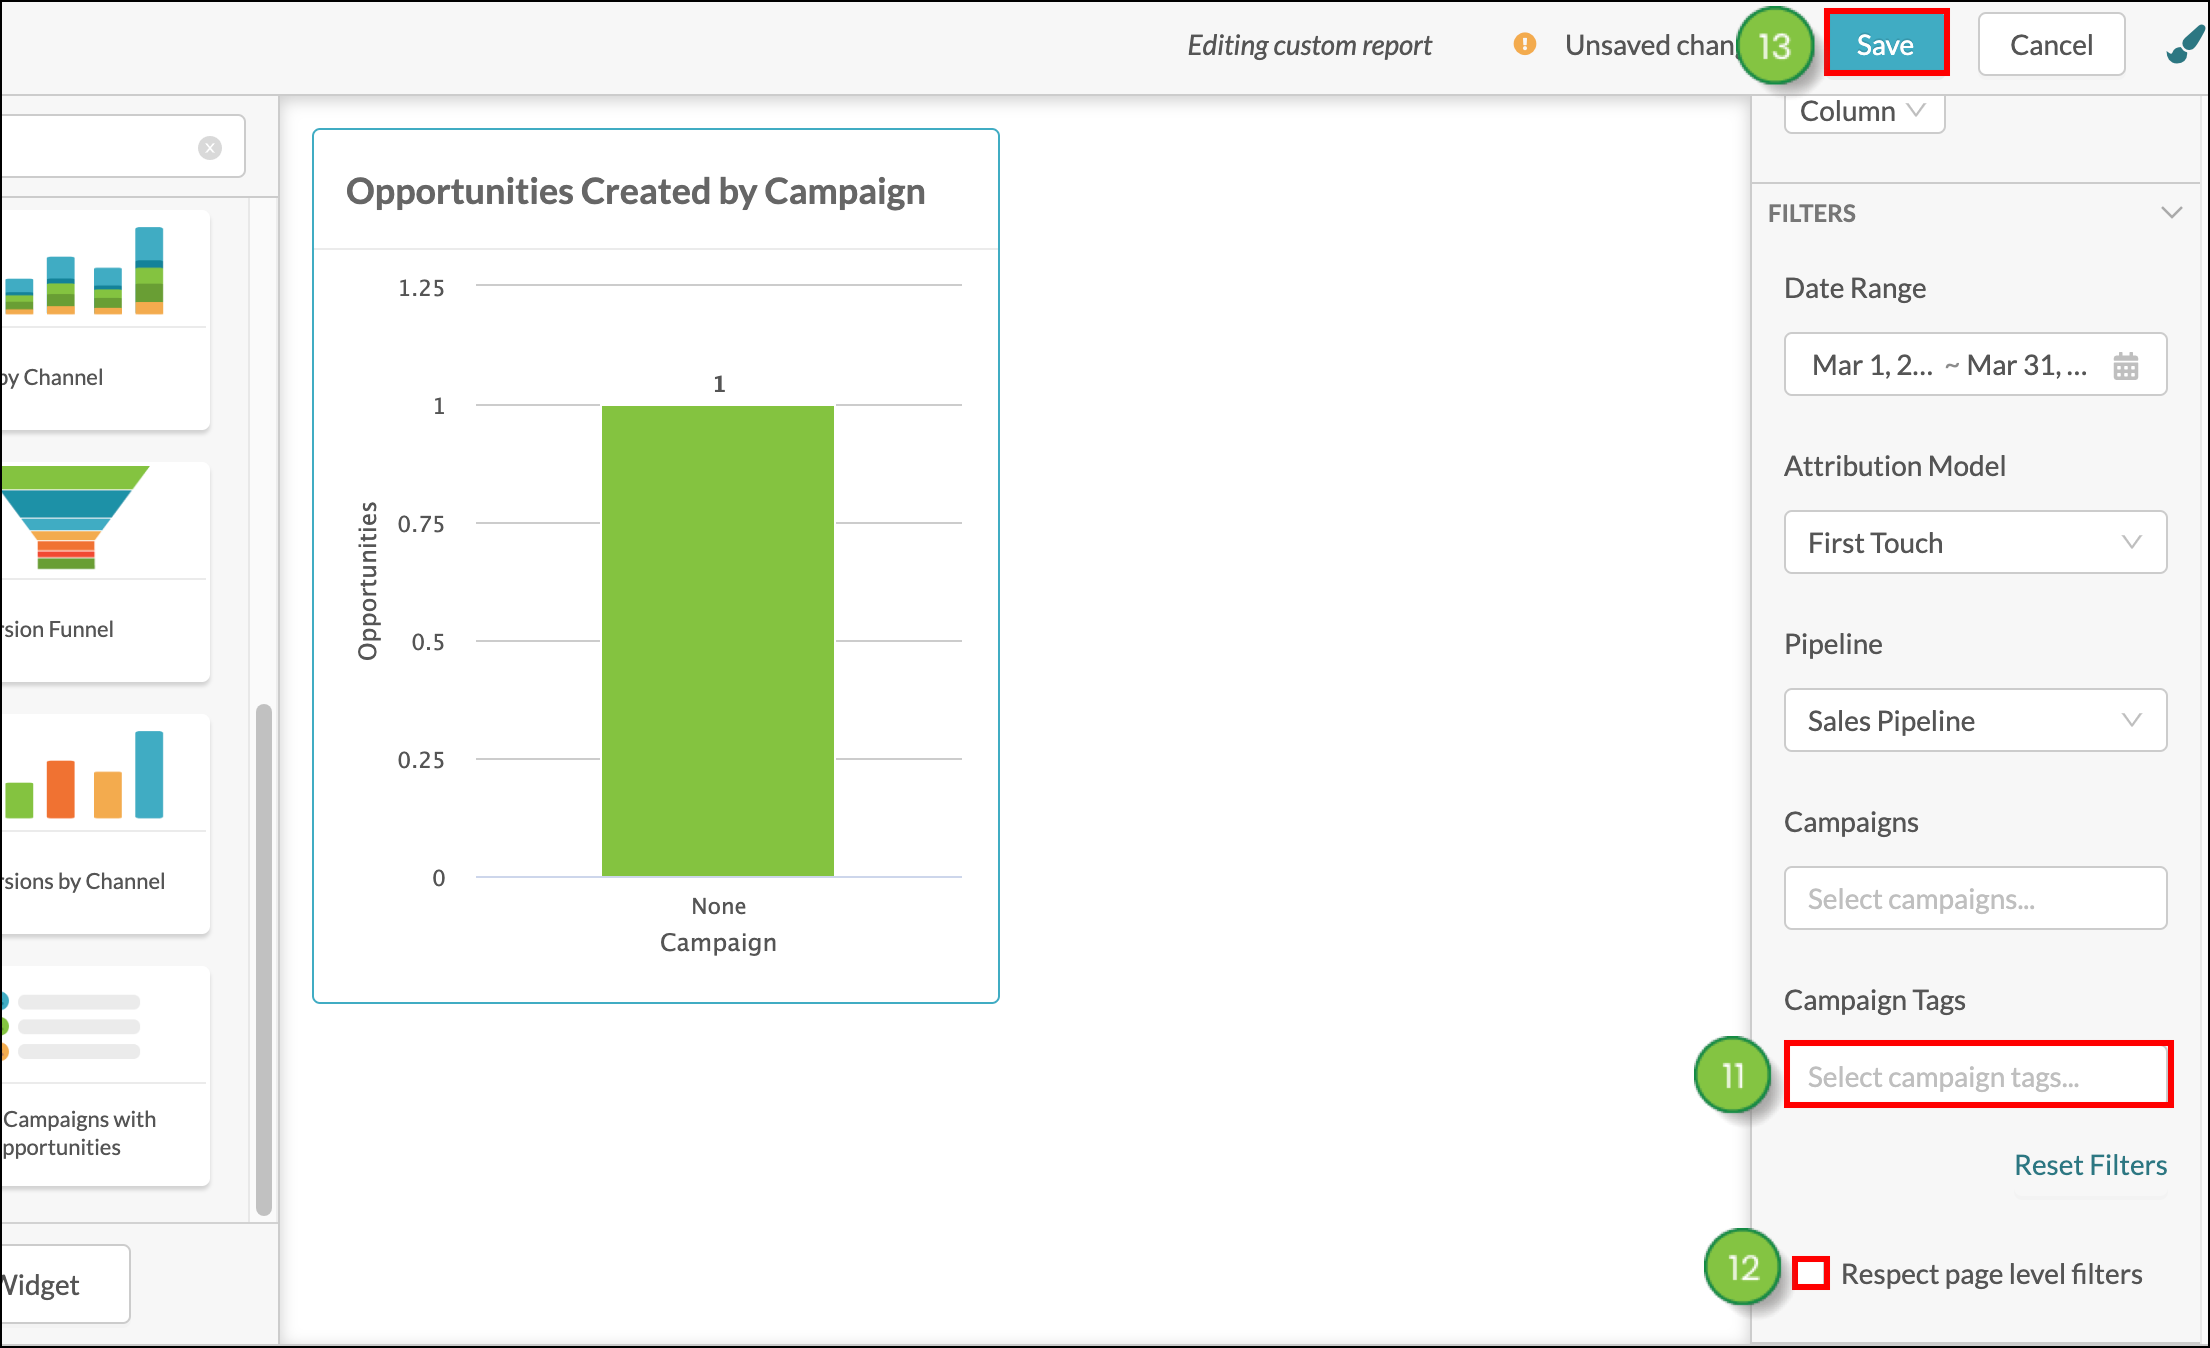
The campaign attribution widget is, in many ways, several widgets in one. It combines the information gathered from conversion goals and attribution methods to provide a comprehensive snapshot of how well your campaigns are performing. That said, when you set the widget in a report, you can display a maximum of one event and attribution.
However, you can utilize the widget multiple times in a single report to better display how one campaign performs when compared to another. By setting your reports to have six conversion event displays and six attribution displays, you can show a complete picture when comparing campaigns.
Consider a large report with twelve versions of the widget, where each individual widget is dedicated to a different event or attribution. Or, if you would prefer a smaller report, consider two reports, with each using six versions of the widget that are dedicated to either events or attributions.
Regardless of how you configure these reports, be sure to compare them to similarly configured campaign reports. Otherwise, you might not be able to correctly determine which campaign is performing better.
For more information on creating custom reports, refer to Using Custom Reports.
You have options when exporting custom report data. Custom reports can export the entirety of their data, or they can export data from individual widgets.
Once a customized report has been configured and saved, it can be exported as a .PDF file. To export customized reports, ensure that you have a saved customized report and navigate to the Custom Report Editor.
 Saved Reports in the toolbar.
 Options > Export PDF.
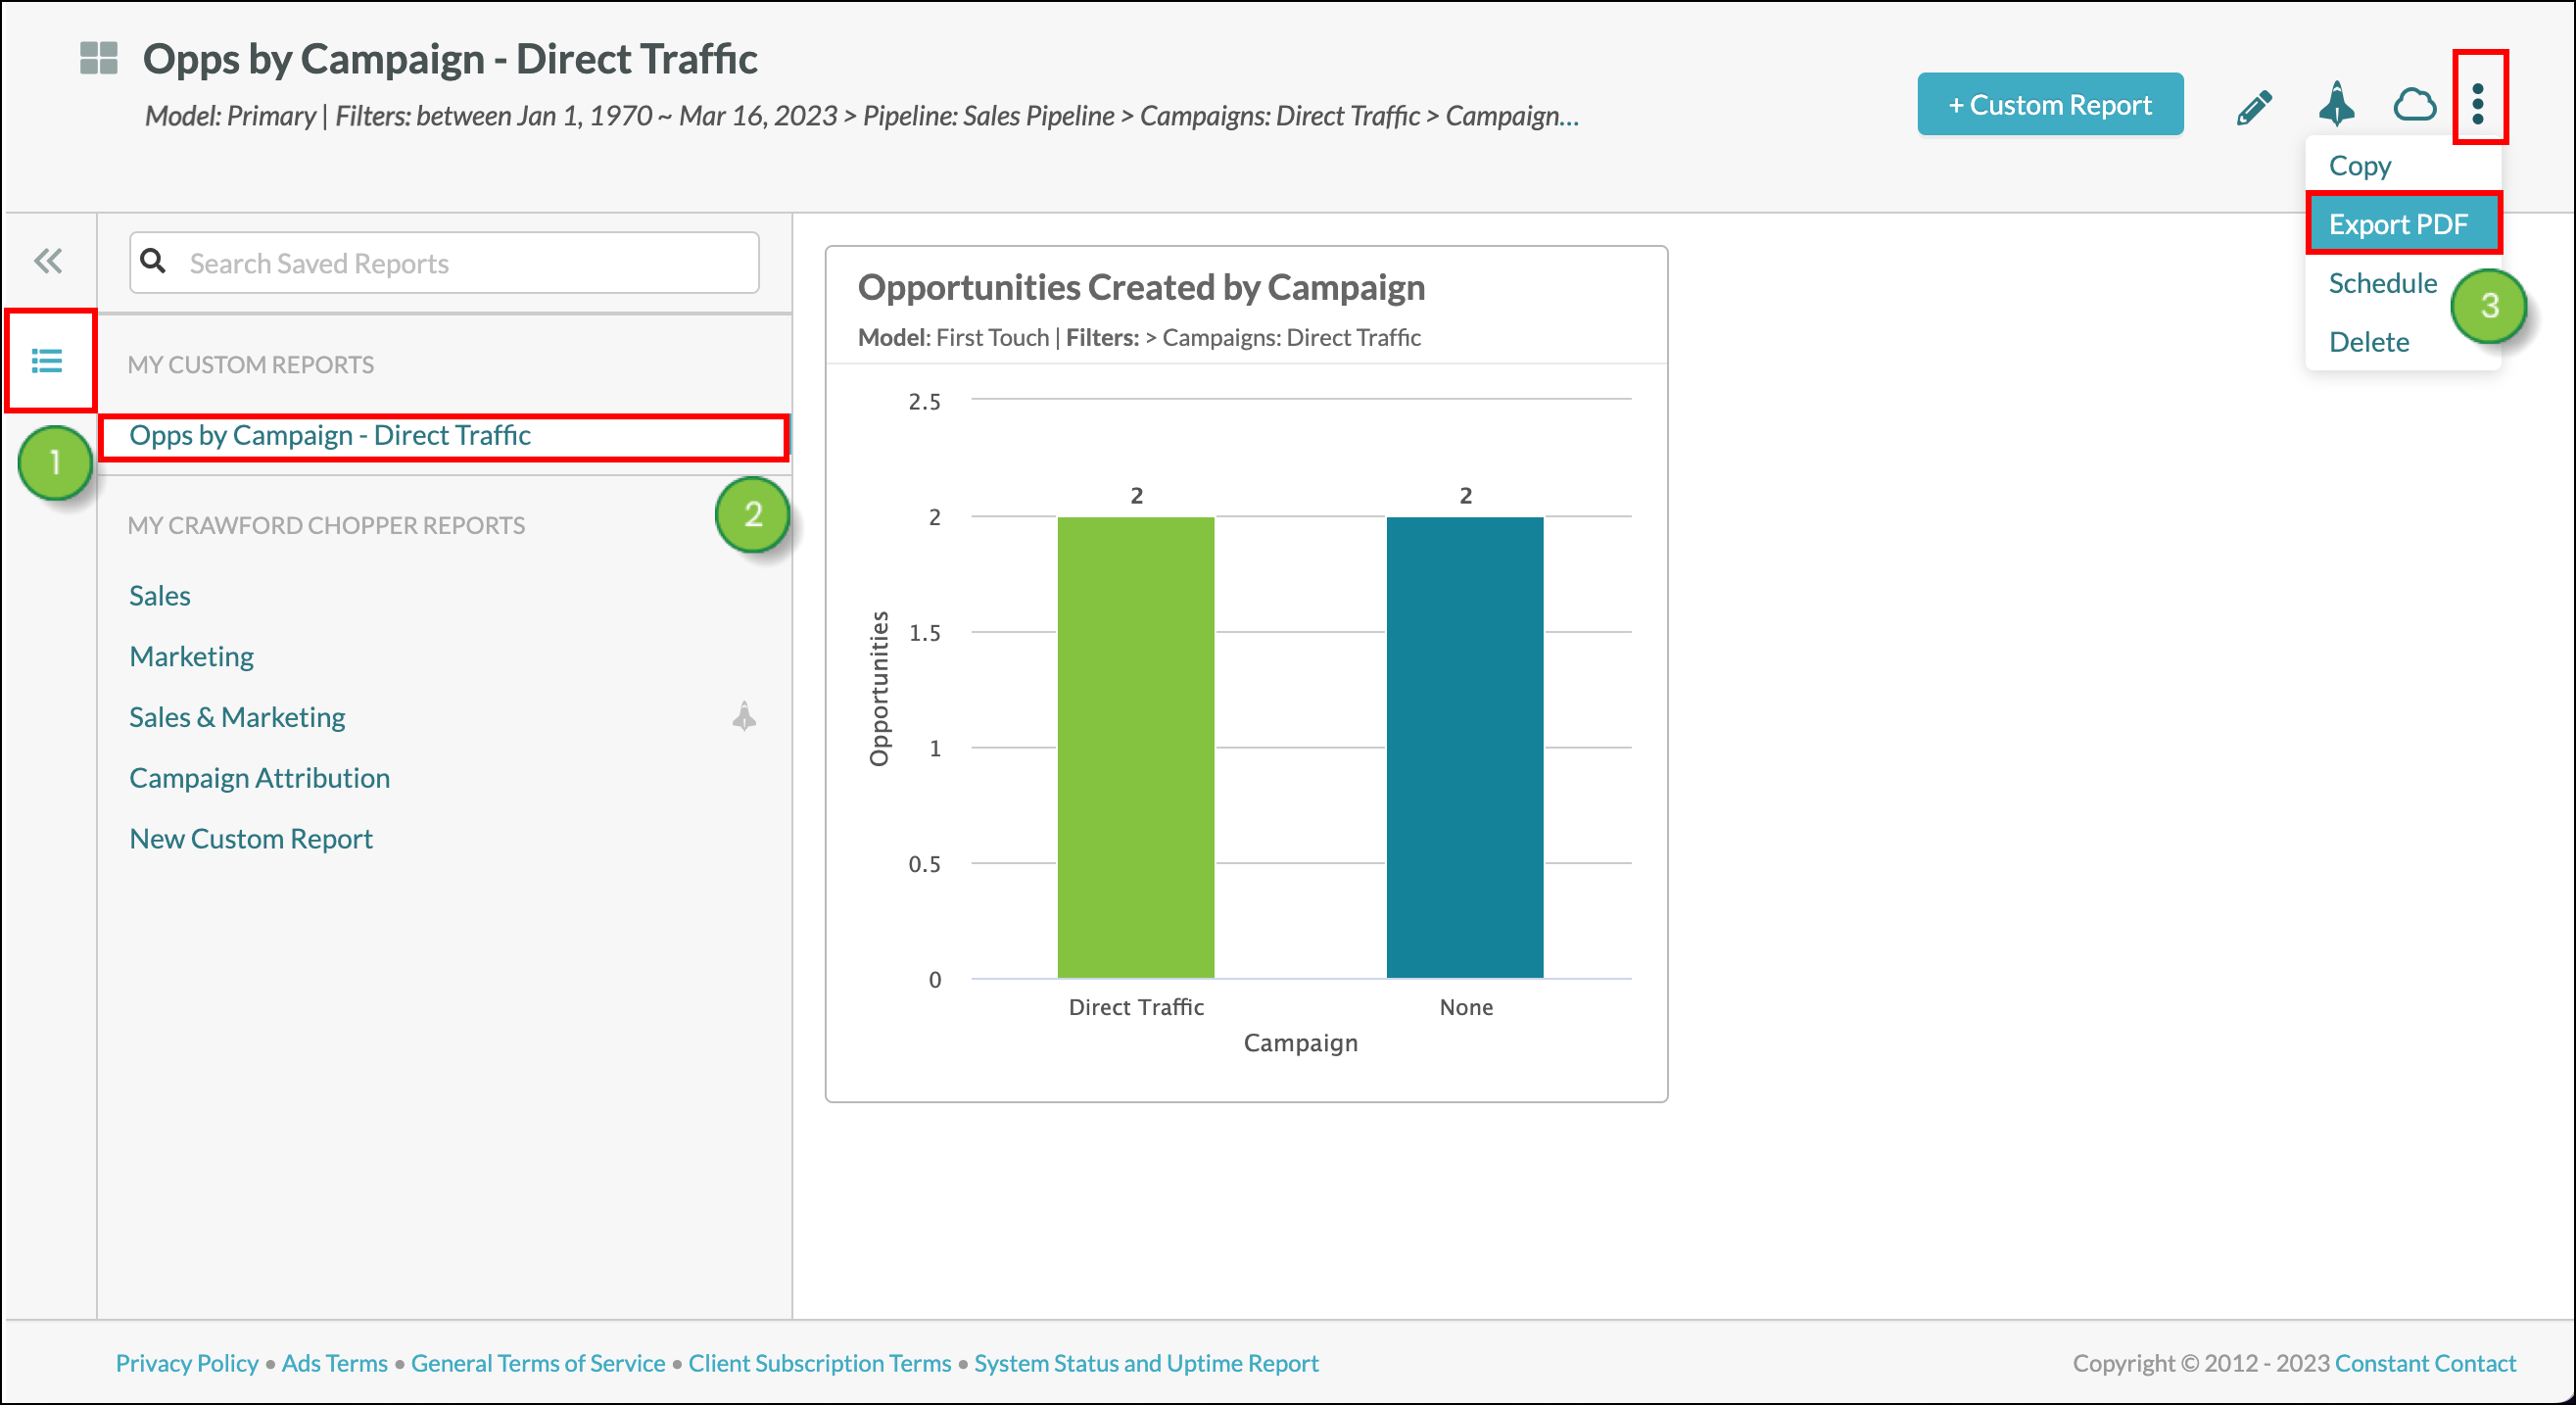
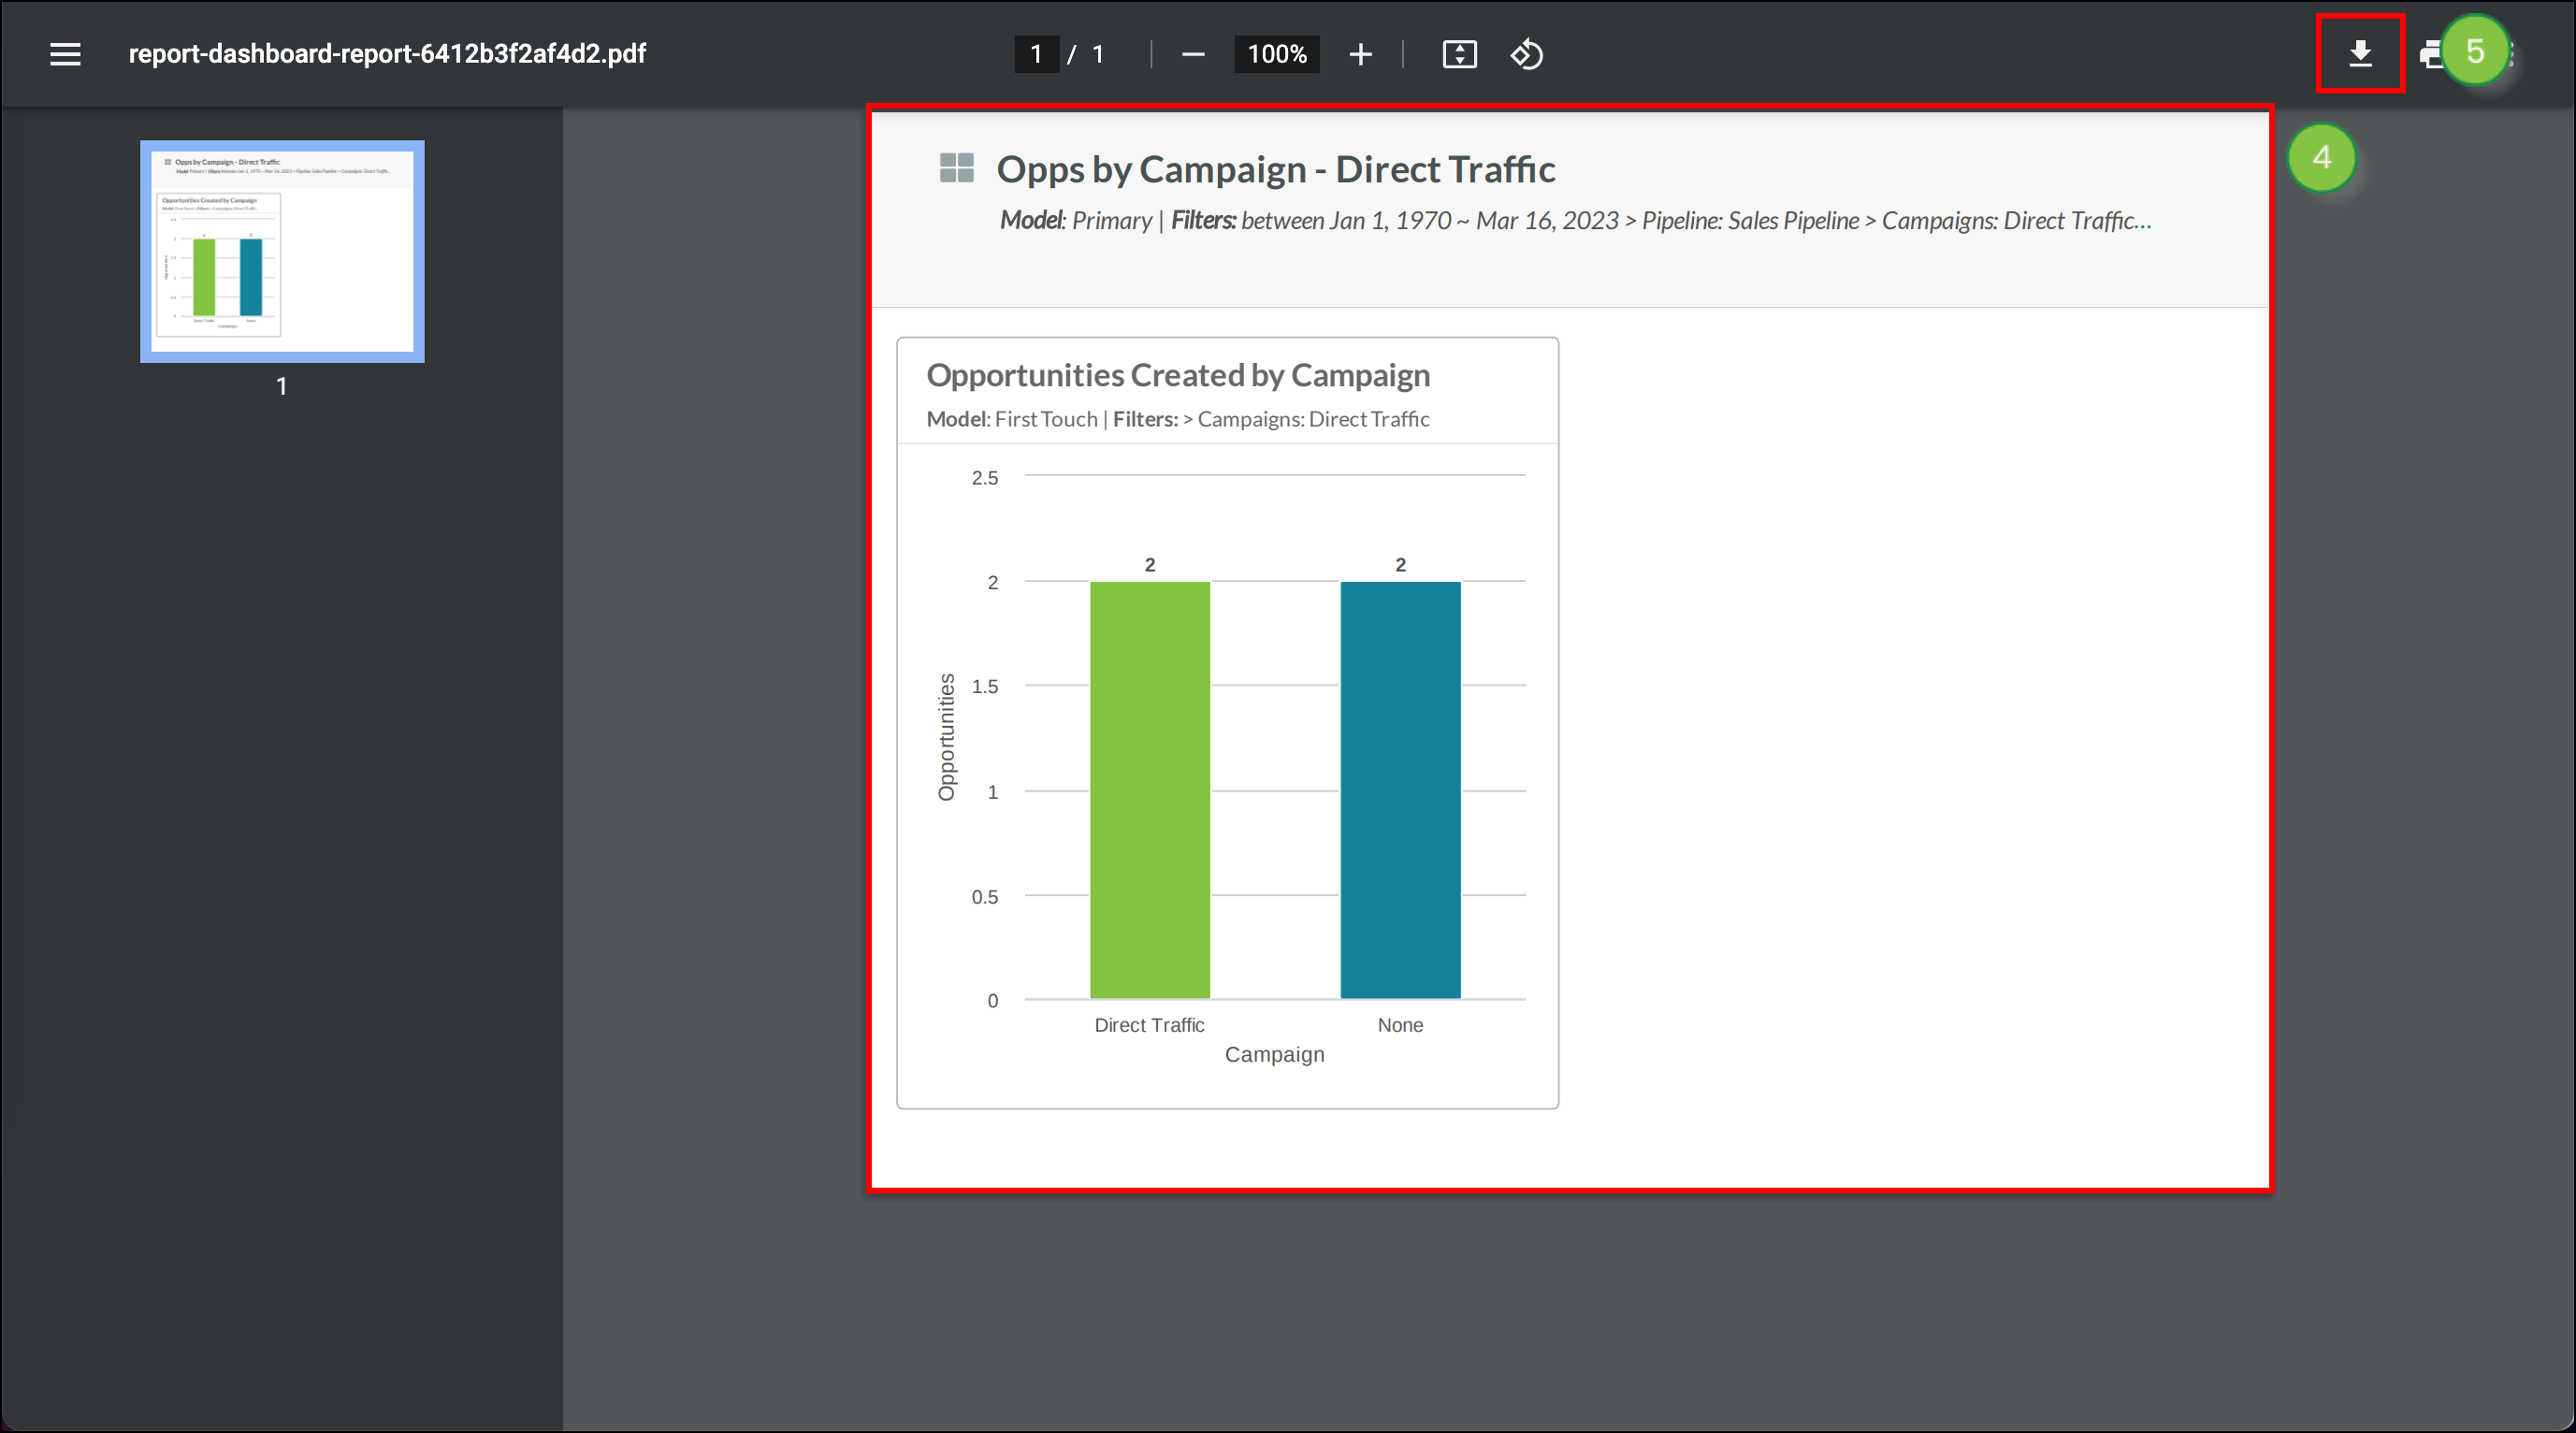
Different web browsers or .PDF viewing programs have different means of saving, downloading, or printing a .PDF file. Refer to their help documentation for more information.
You can export data from individual widgets. Exported data will be saved to your computer as a .CSV file. To export widget data, create or edit a customized report.
Widgets in the toolbar. Options > View.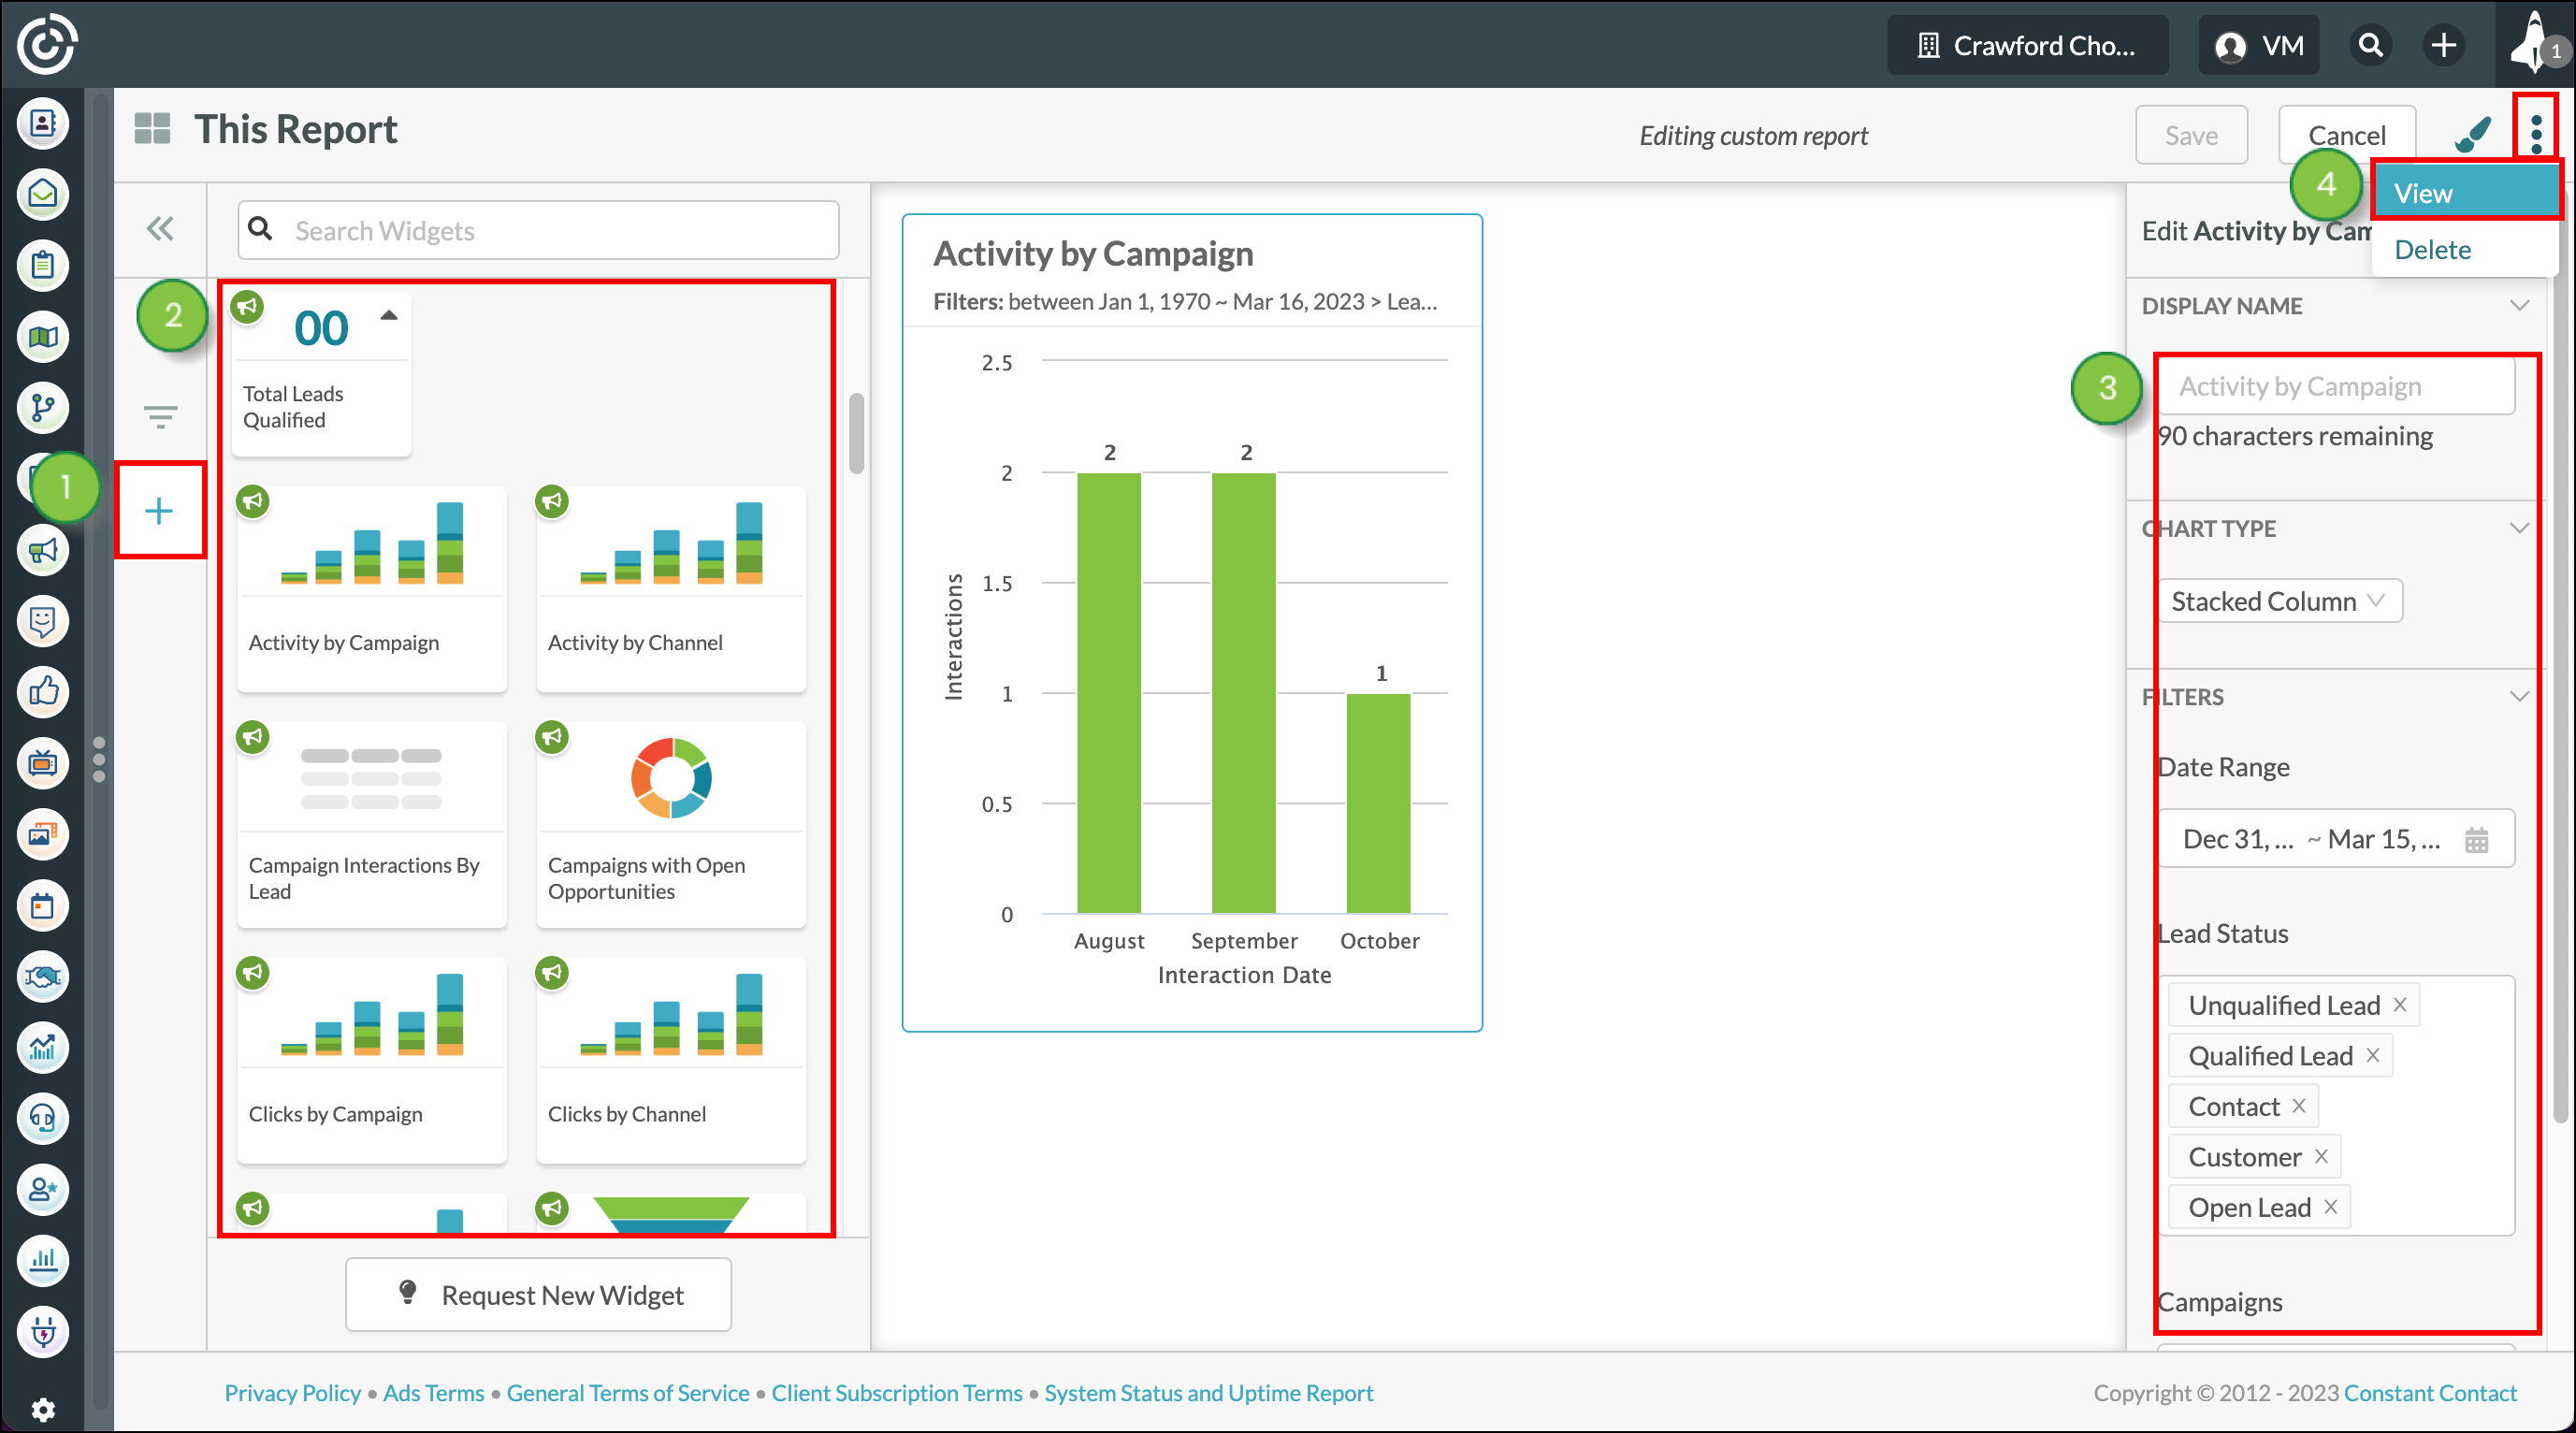
 Export .CSV.
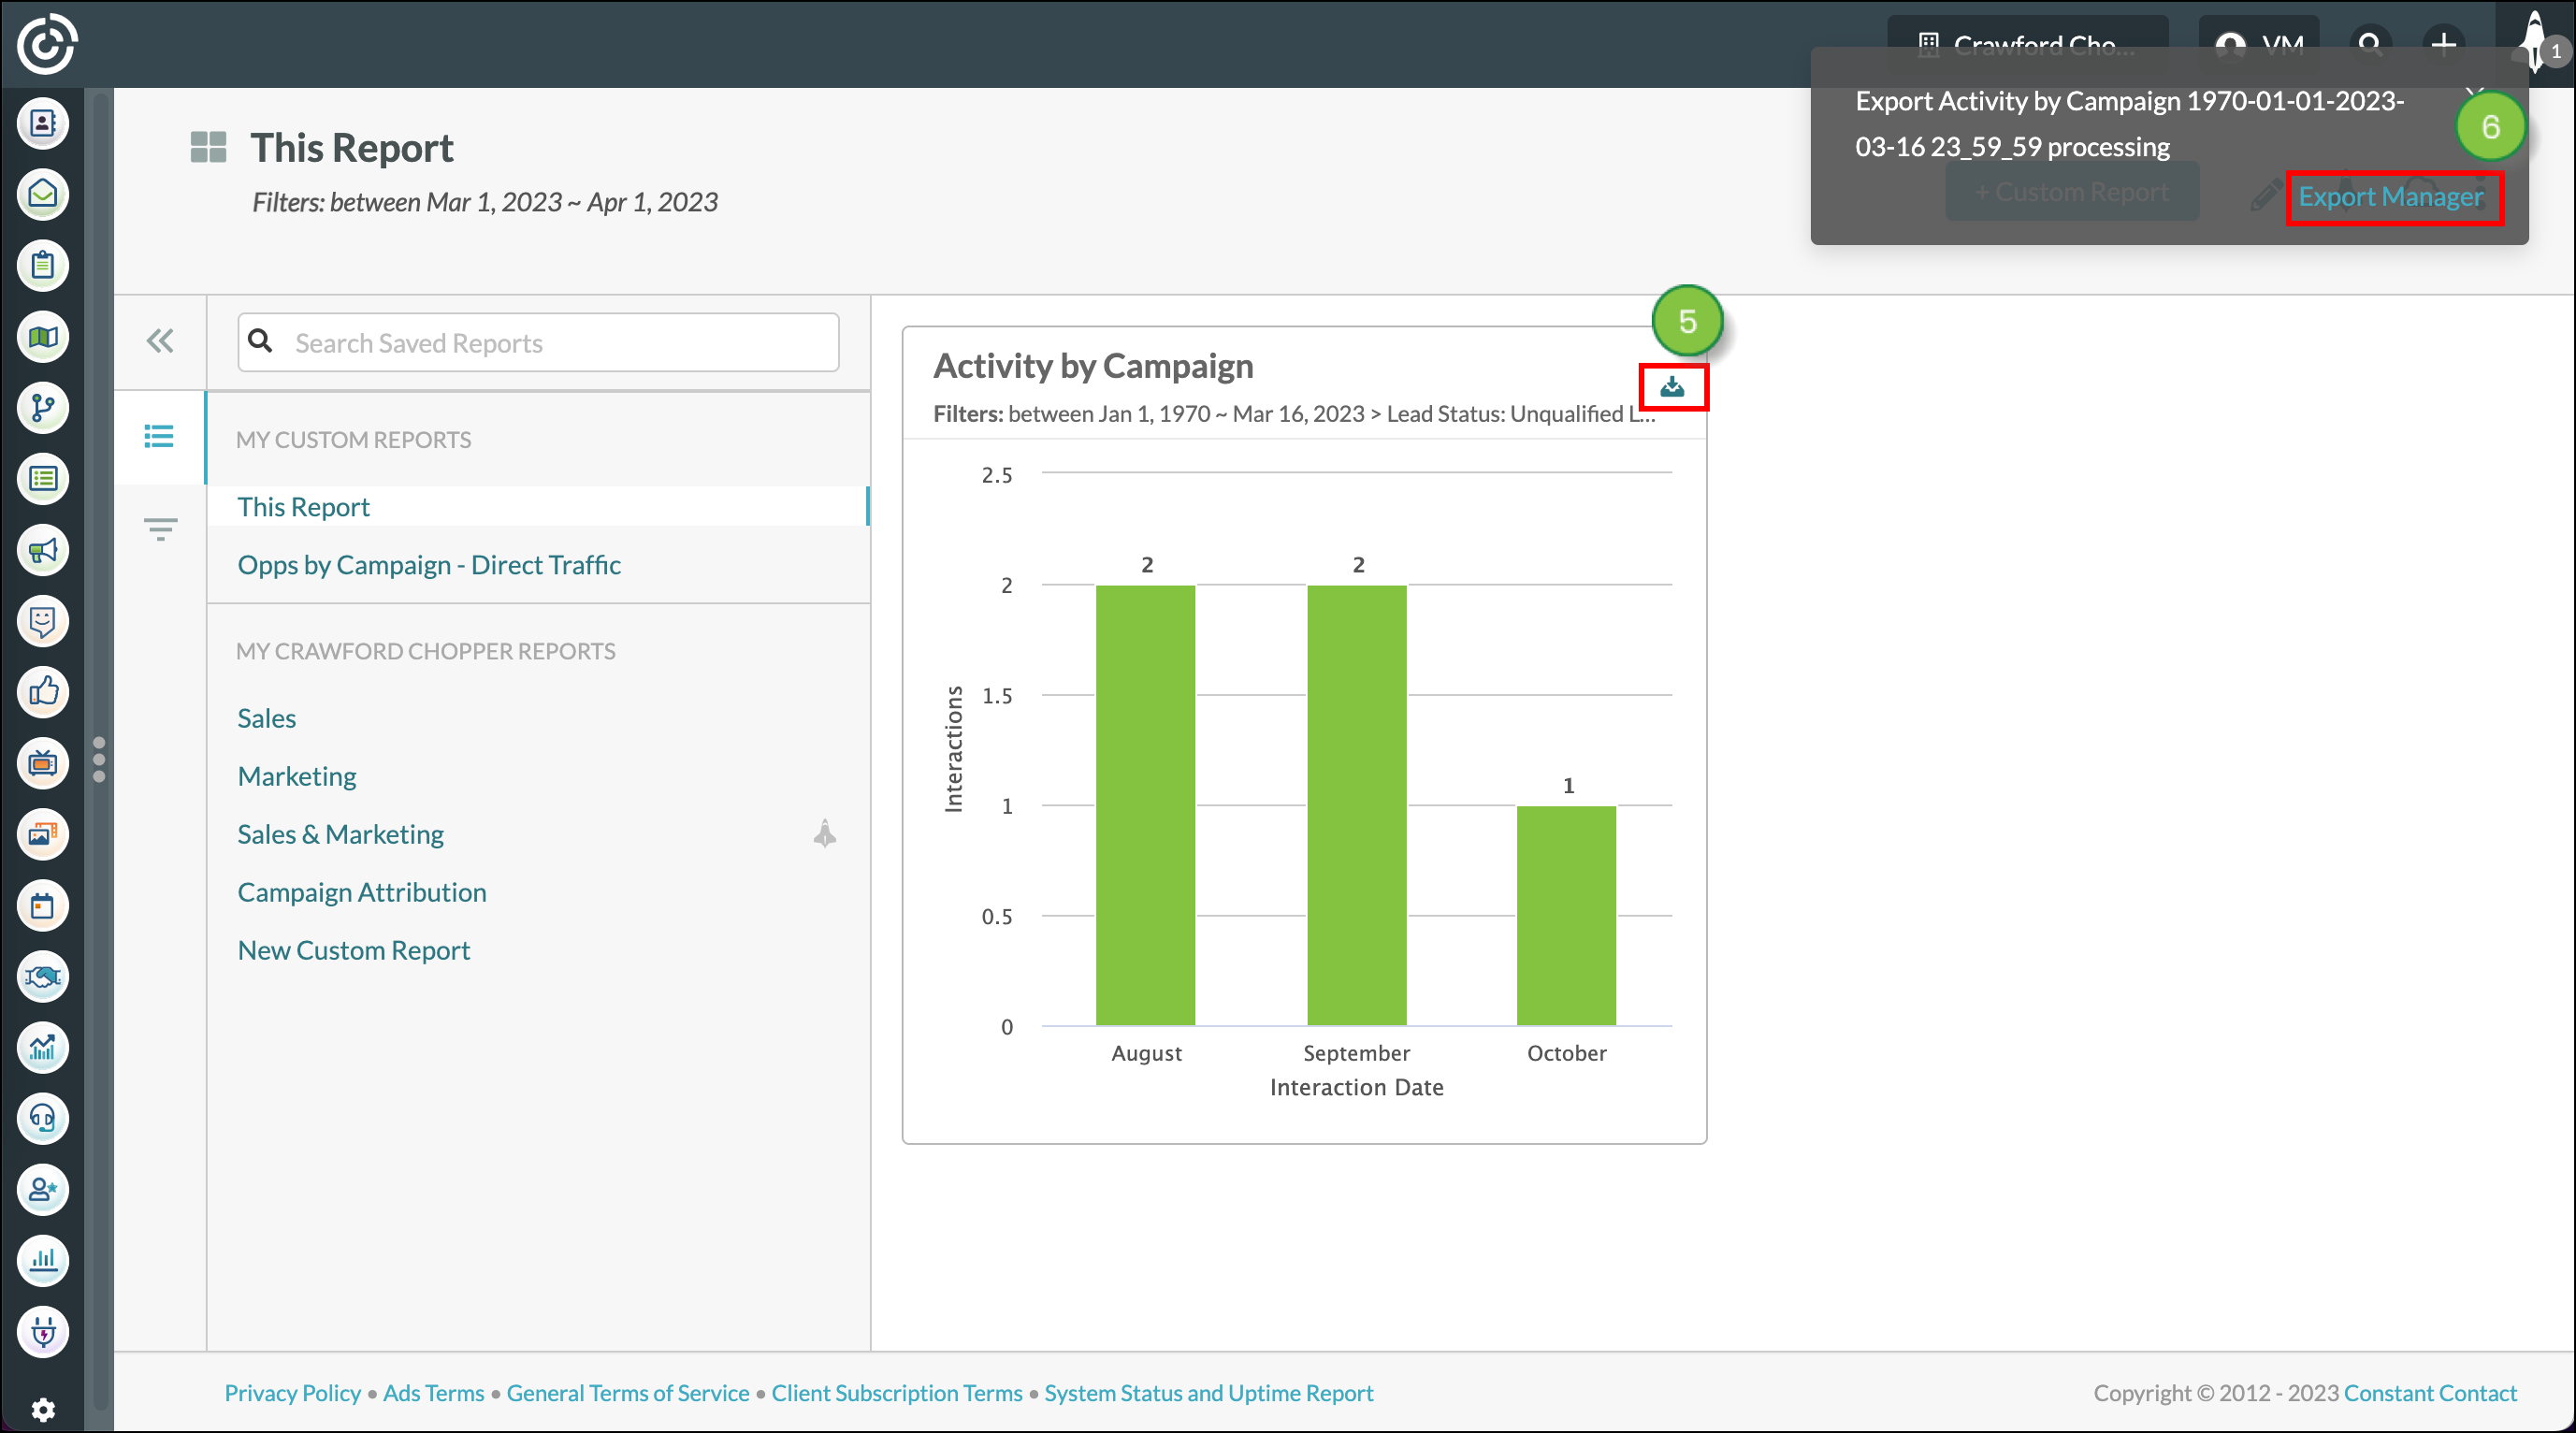
Click the exported customized report widget file to download it to your computer.
Created reports can be saved to display as individual dashboards on the Launchpad. These then can be set to be what you see when you first log in to Lead Gen & CRM during a given day.
Additionally, you can share your customized dashboards. They are shared through Cloud Dashboards, which are preset displays that are broadcasted to external monitors or televisions. Shared dashboards can be accessed via URLs that are unique for each individual dashboard.
Refer to Launchpad Overview for more information on setting and sharing report dashboards through the Launchpad.
Copyright © 2026 · All Rights Reserved · Constant Contact · Privacy Center