These widgets are all different from one another and display specific information on a key component of your business. Using Custom Reports can be mixed and matched in custom reports as needed, which can result in specific and granular reports—or something far more broad and all-encompassing.
This article will provide information on all available widgets for the custom reports feature.
| Administrators | ✓ | |
| Company Managers | ✓ | |
| Marketing Managers | ✓ | |
| Sales Managers | ✓ | |
| Salespersons | ✓ | |
| Jr. Salespersons |
| Tip: Are you looking for information about Constant Contact’s Email and Digital Marketing product? This article is for Constant Contact’s Lead Gen & CRM product. Head on over to the Email and Digital Marketing articles by clicking here. Not sure what the difference is? Read this article. |
Custom reports, as the name implies, let you customize created reports with only the information you want. This information is displayed by different widgets, which can be dragged and dropped into a custom report as needed.
Different widgets will display different information. The available widget types are as follows:
| Icon |
Name |
Description |
| ||
|
Area | A graph that is meant to compare different quantities of data. |
| |||
|
|
Donut | A graph that display portions of data as a proportion of the entire selection of data. |
| ||
 | Funnel | A series of data points shown in sequence, in order from the initial point to the final point. |
| ||
|
| List | A series of similar data points presented consecutively in a descending order. |
| ||
|
|
Stacked | A graph that compares portions of data to the whole amount of data over a period of time or by way of different parameters. |
| ||
|
|
Stat with | A numerical statistic along with a percentage that shows a positive or negative trend over time. |
| ||
|
| Table | A graph that displays its information over a series of different rows, columns, or a combination of both. |
| ||
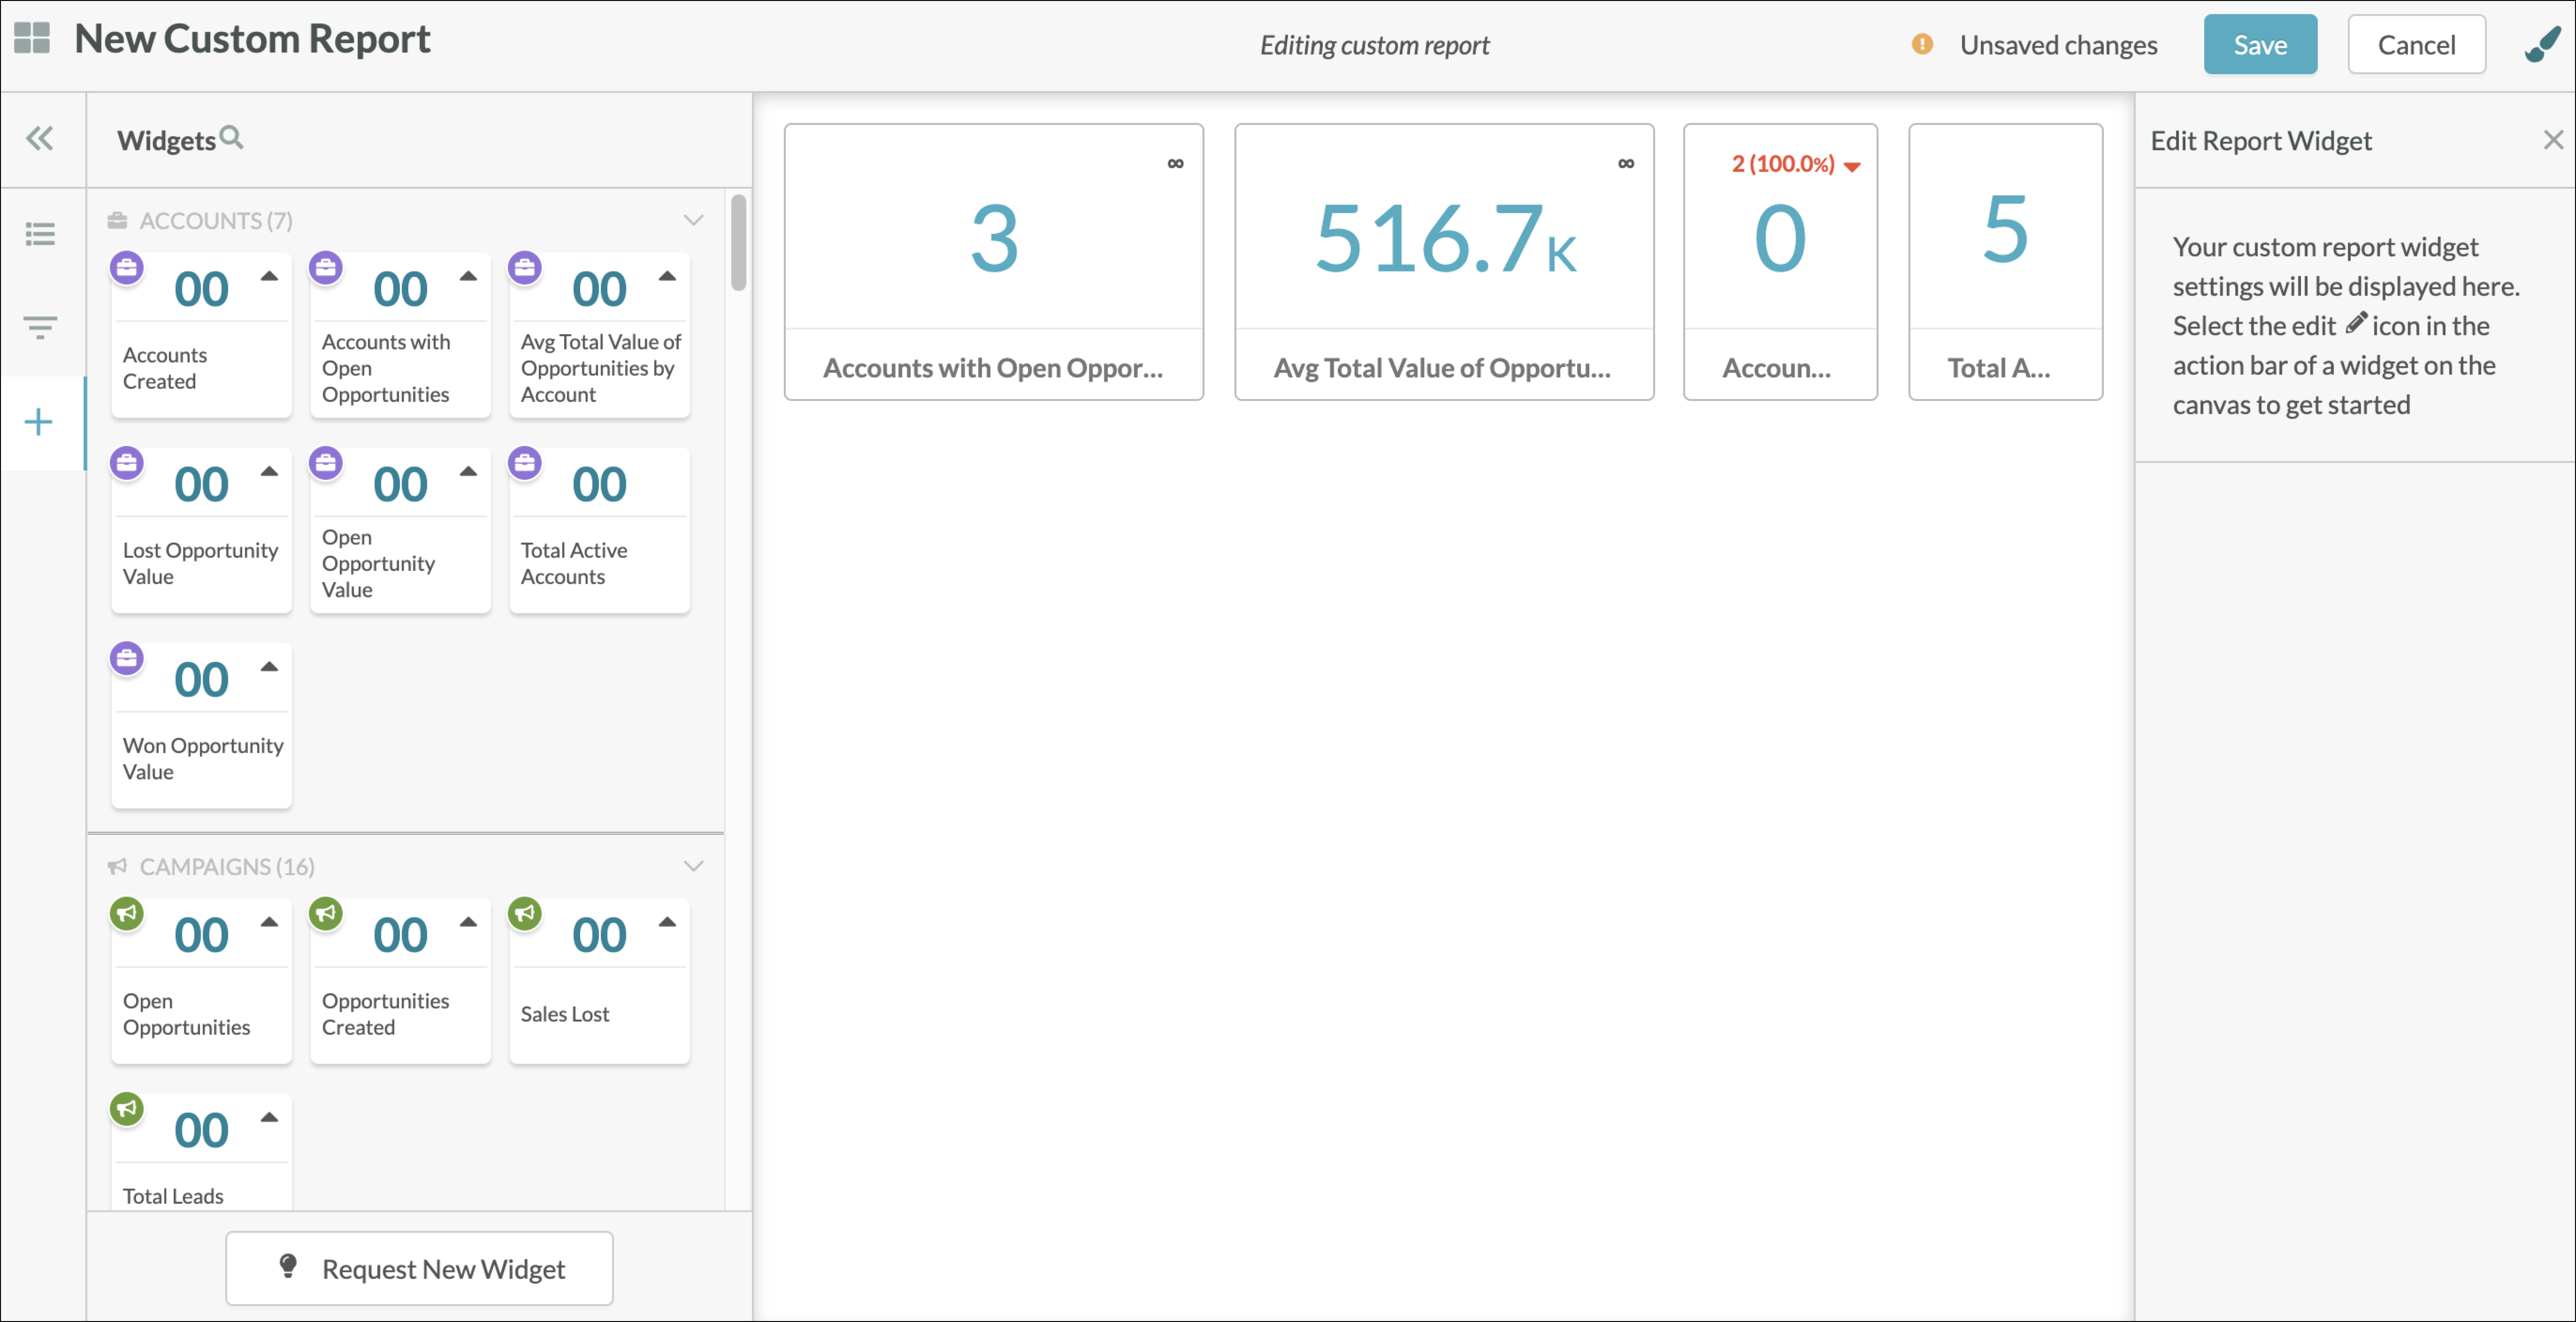
An account in Lead Gen & CRM is just like a folder in a digital filing cabinet, where you can store all similar contacts and opportunities to one single location. Account widgets allow you to see account changes over time, and opportunity value (won, lost, and total). Track the success of your sales team and account progress.
Available ![]() Account widgets are as follows:
Account widgets are as follows:
| Type |
Name |
Description |
| ||
|
|
Accounts Created | Shows the total number of accounts created in a given time period. | |||
 | Accounts With Open Opportunities |
Shows the total number of accounts created in a given time period with open opportunities. | |||
| Average Contacts Per Account |
Shows the average number of contacts assigned to accounts. | |||
|
Avg Total Value of Opportunities by Account |
Shows the average total value of opportunities assigned to the selected accounts in a given time period. | |||
|
Lost Opportunity Value | Shows the total value of opportunities that have been closed lost for all accounts in a given time period. | |||
|
Open Opportunity Value |
Shows the total value of open opportunities for all accounts in a given time period. | |||
|
Total Active Accounts |
Shows the total number of active accounts. | |||
|
Won Opportunity Value | Shows the total value of opportunities that have been closed won for all accounts in a given time period. | |||
 |
Opportunities By Account | Displays a table of accounts and the opportunities assigned to them. Table columns include Account Name, Opportunity Name, Expected Value for the opportunity, Total Value, and the number of Leads. | |||
 |
Top Accounts by Total Opportunity Value
| Displays the top 10 accounts with the greatest total opportunity value. |
Campaigns are any marketing initiative for which you would like to track results. With campaigns, you can track lead conversions from the first interaction all the way through the final sale. Campaigns allow you to see the end-to-end return on investment (ROI) of your marketing efforts, and you can automatically tie your marketing initiatives to revenue goals.
Available ![]() Campaign widgets are as follows:
Campaign widgets are as follows:
| Type |
Name |
Description |
| ||
|
|
Open | Shows which of your campaigns are generating the most opportunities. | |||
| Opportunities Created |
Shows the total number of opportunities created by a campaign. | |||
|
Sales Lost |
Shows the total number of sales that were lost in a campaign. | |||
|
Total Leads | Shows the total number of leads that were qualified during the course of a campaign. | |||
 |
Activity by |
Shows the total number of campaign interactions within a selected timeframe. | |||
|
Activity by |
Shows the total number of campaign interactions by a channel within a selected timeframe. | |||
|
Campaign Interactions By Lead |
Displays a table of leads and the campaigns associated with each lead. Table columns include Lead, Campaign, Interaction Date, and Interaction Type (Form Fill, Manual, etc.) | |||
 |
Campaigns | Shows the total number of open opportunities in a campaign. | |||
|
Clicks by |
Shows the total number of page impressions associated with a campaign interaction. | |||
|
Clicks by |
Shows the total number of page impressions associated with a campaign interaction, grouped by channels. | |||
|
Contacts by | Shows how many contacts your campaigns are generating. | |||
|
Conversion | Tracks and displays data on selected conversion goals. | |||
|
Conversions by Campaign | Shows the total number of opportunities created by a campaign. | |||
| Conversions by Channel | Shows the total number of opportunities created by a channel. | |||
|
| Top 10 Campaigns by Revenue | Shows how much your campaigns are contributing to your overall sales revenue. Displays the top 10 campaigns in descending order. | |||
|
|
Top 10 | Shows which of your campaigns have resulted in closed-won opportunities. Displays the top 10 campaigns in descending order. | |||
|
|
|
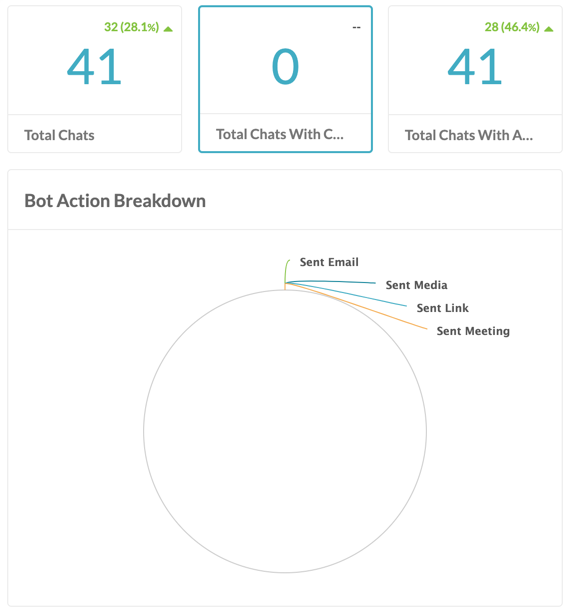
Chatbots are an automated communication service. They allow users to search for answers about your content, and they provide a series of answers and means of collecting data. Conversations through chatbots use a specific logic path. This logic path best emulates person-to-person communication.
Available ![]() Chatbot widgets are as follows:
Chatbot widgets are as follows:
| Type |
Name |
Description |
| ||
|
Total Chats |
The total number of chatbot chats during a specified period of time, as well as how much that number has increased or decreased. | |||
|
Total Chats with | The total number of chatbot chats with anonymous leads during a specified period of time, as well as how much that number has increased or decreased. | |||
|
Total Chats |
The total number of chatbot chats with contacts during a specified period of time, as well as how much that number has increased or decreased. | |||
|
Total Contacts |
The total number of contacts created as a result of chatbot chats during a specified period of time, as well as how much that number has increased or decreased. | |||
|
Total Form |
The total number of form fills as a result of chatbot chats during a specified period of time, as well as how much that number has increased or decreased. | |||
|
Total Revenue |
The total revenue generated as a result of chatbot chats during a specified period of time, as well as how much that number has increased or decreased. | |||
|
Bot Action | Shows the rates for which actions were chosen in your chatbot workflows. | |||
|
Contacts | Shows the number of contacts created by interacting with your chatbots. | |||
|
|
Conversation | Shows the number of conversations with your chatbot workflows. | |||
|
|
Opportunities | Shows which of your chatbots are generating the most opportunities as a result of new leads. | |||
|
|
Total Chats | Shows the total number of chatbot interactions on each page where the chatbot is active. | |||
|
| Total Chats Per Page with Known Leads | Shows the total number of chatbot interactions with known leads on each page where the chatbot is active. | |||
|
Total |
Shows the total number of conversations for each chatbot for any given time period. |
Contacts are unique records in the Lead Gen & CRM Contact Manager. Contacts in Lead Gen & CRM can be considered either tracked or untracked, depending on if they have completed an appropriate conversion event.
Available ![]() Contact widgets are as follows:
Contact widgets are as follows:
| Type |
Name |
Description |
| ||
|
| Contacts Added | The total number of new contacts that were created during a specified period of time, as well as how much that number has increased or decreased. |
| ||
|
| Contacts Added by Lead Status | Shows the number of leads that were turned into contacts. |
| ||
|
| Contacts by Lead Status | Shows the status of available contacts. |
| ||
Emails are the foundation of any marketing automation platform, as they allow you to send your message to many different recipients. You will need to measure your recipients' engagement to better connect with them.
Available ![]() Email widgets are as follows:
Email widgets are as follows:
| Type |
Name |
Description |
| ||||
|
Average Email | The average number of emails that were clicked through per day during a specified period of time, as well as how much that number has increased or decreased. | |||||
| Average Email Conversion Rate |
The average number of new customers as a result of email interaction during a specified period of time, as well as how much that number has increased or decreased. | |||||
| Email Click Rate |
The overall percentage of sent emails that had links that were clicked. | |||||
| Email Open Rate |
The overall percentage of sent emails that were opened by recipients. | |||||
|
| Sales Influenced by Email | The total number of closed-won opportunities that had contacts who opened or clicked emails during a specified period of time, as well as how much that number has increased or decreased. | |||||
|
| Total Email Sends | The total number of emails sent during a specified period of time. | |||||
|
| Unique Email Opens | The total number of unique email opens during a specified period of time, as well as how much that number has increased or decreased. | |||||
 | Email Performance |
Displays the following email metrics for a selected date range:
| |||||
|
| Revenue by Email | Shows which emails contributed the most revenue. | |||||
|
| Top 10 Emails by Conversion Rate | Shows the emails that generated the most new customers. Displays the top 10 emails in descending order. |
| Forms are windows or screens that contain numerous fields or spaces to enter data. Forms are used as a means to establish lead tracking. Available |  Click to enlarge. Click to enlarge. | |
| Type |
Name |
Description |
| ||
|
|
Average Form | The average number of forms that were submitted per day during a specified period of time, as well as how much that number has increased or decreased. |
| ||
|
|
New Contacts from Form Fills | The total number of contacts gained from all form submissions during a specified period of time as well as how much that number has increased or decreased. |
| ||
|
| Sales Influenced by Form | The number of closed-won opportunities that had contacts who submitted forms during a specified period of time, as well as how much that number has increased or decreased. |
| ||
|
| Total Form Submissions | The total number of form submissions during a specified period of time, as well as how much that number has increased or decreased. |
| ||
|
| Revenue by Form | Shows which forms contributed the most revenue. |
| ||
| The Media Center houses trackable media files. This enables you to track your leads’ interaction with important content and follow up with them in a meaningful way. Available |  Click to enlarge. Click to enlarge. | |
| Type |
Name |
Description |
| ||
|
|
Average Media | The average number of media assets that were viewed per day during a specified period of time, as well as how much that number has increased or decreased. |
| ||
|
| Sales Influenced by Media | The total number of closed-won opportunities that had contacts who viewed media assets during a specified period of time, as well as how much that number has increased or decreased. |
| ||
|
|
Total Media | The total number of views from all media assets during a specified period of time, as well as how much that number has increased or decreased. |
| ||
|
| Unique Media Views | The total number of unique contacts who viewed media assets during a specified period of time, as well as how much that number has increased or decreased. |
| ||
|
| Revenue by Media | Shows which media assets contributed the most revenue. |
| ||
|
| Top 10 Media by Views | Shows which media assets were viewed the most. Displays the top 10 media assets in descending order. |
| ||
|
|
Unique Media | Shows which media assets generated the most contacts. |
| ||
|
|
|
|
| Opportunities are created and added to a pipeline to monitor progress across deal stages in the sales process. You can track the estimated revenue, estimated close date, and the contacts included in a specific opportunity. Available |  Click to enlarge. Click to enlarge. | |
| Type |
Name |
Description |
| ||
|
| Total Revenue |
The total revenue generated during a specified period of time, as well as how much that number has increased or decreased. This widget can take days to populate closed/won opportunities. |
| ||
|
| Total Sales | The total number of sales made during a specified period of time, as well as how much that number has increased or decreased. |
| ||
 |
Expected Value | Shows deal stages and their respective expected close dates and value amounts. |
| ||
|
| Expected Value by Deal Stage | Shows deal stages and their respective expected value amounts. |
| ||
|
Revenue by | Shows the best sales performances. Can be filtered to close dates, individual team members, or whole teams. |
| ||
|
| Revenue by Owner | Shows the best sales performances. Can be filtered to individual team members or whole teams. |
| ||
With the Sales Dialer, you can place outbound calls directly from a contact's record and access the call recordings and notes in the contact's Life of the Lead. You can also save recordings of logged calls.
Available Sales Dialer widgets are as follows:
| Type |
Name |
Description |
| ||
|
Total Logged Calls | The total number of logged calls that were made or received by the user, along with the outcome of the call. |
|
| Tasks are activities that your users will need to complete within a certain amount of time. Tasks include making phone calls, sending emails, hosting meetings, or other general business activities. Available |  Click to enlarge. Click to enlarge. | |
| Type |
Name |
Description |
| ||
|
Open Tasks | The total number of tasks that were open during a specified period of time, as well as how much that number has increased or decreased. |
| ||
|
Overdue Tasks | The total number of tasks that were considered as overdue during a specified period of time, as well as how much that number has increased or decreased. |
| ||
|
|
Task |
The percentage of tasks that were completed during a specified period of time, as well as how much that number has increased or decreased. Task completion rate is the count of total completed tasks during the selected period divided by the total tasks in the selected period. This is expressed as follows: (Completed/Total) *100 = Rate% |
| ||
|
Tasks | The total number of tasks completed during a specified period of time, as well as how much that number has increased or decreased. |
| ||
|
| Tasks Completed Late or Rescheduled | The total number of tasks that were completed after their due date or were rescheduled during a specified period of time, as well as how much that number has increased or decreased. |
| ||
|
| Tasks Completed on Time | The total number of tasks that were completed on or before their due date during a specified period of time, as well as how much that number has increased or decreased. |
| ||
|
Tasks | The total number of tasks that were considered as due during a specified period of time, as well as how much that number has increased or decreased. |
| ||
|
Completed | Shows on a user-by-user basis the number of tasks completed after their initial deadline. |
| ||
|
Completed | Shows on a user-by-user basis the number of tasks completed on or before their deadline. Presented in list format. |
| ||
|
Completed | Shows on a user-by-user basis the number of tasks completed on or before their deadline. Presented in a variety of chart formats. |
| ||
|
|
Task Activity | Shows certain task metrics on a user-by-user basis, such as how many tasks were due, open, or completed. |
| ||
|
|
Task |
Shows on a user-by-user basis how many tasks were completed in the current period of time, and compares that information with task information from a previous period of time. Task completion rate is the count of total completed tasks during the selected period divided by the total tasks in the selected period. This is expressed as follows: (Completed/Total) *100 = Rate% |
| ||
|
Total | Shows on a user-by-user basis the number of tasks that were completed. Presented in list format. |
| ||
|
Total | Shows on a user-by-user basis the number of tasks that were completed. Presented in a variety of chart formats. |
| ||
|
| Total Open Tasks by User | Shows on a user-by-user basis how many tasks there were in the current period of time, and compares that information with task information from a previous period of time. |
| ||
|
| Total Open Tasks by User | Shows on a user-by-user basis the number of total tasks in the current period of time, and compares that information with task information from a previous period of time. |
| ||
|
|
|
Copyright © 2026 · All Rights Reserved · Constant Contact · Privacy Center