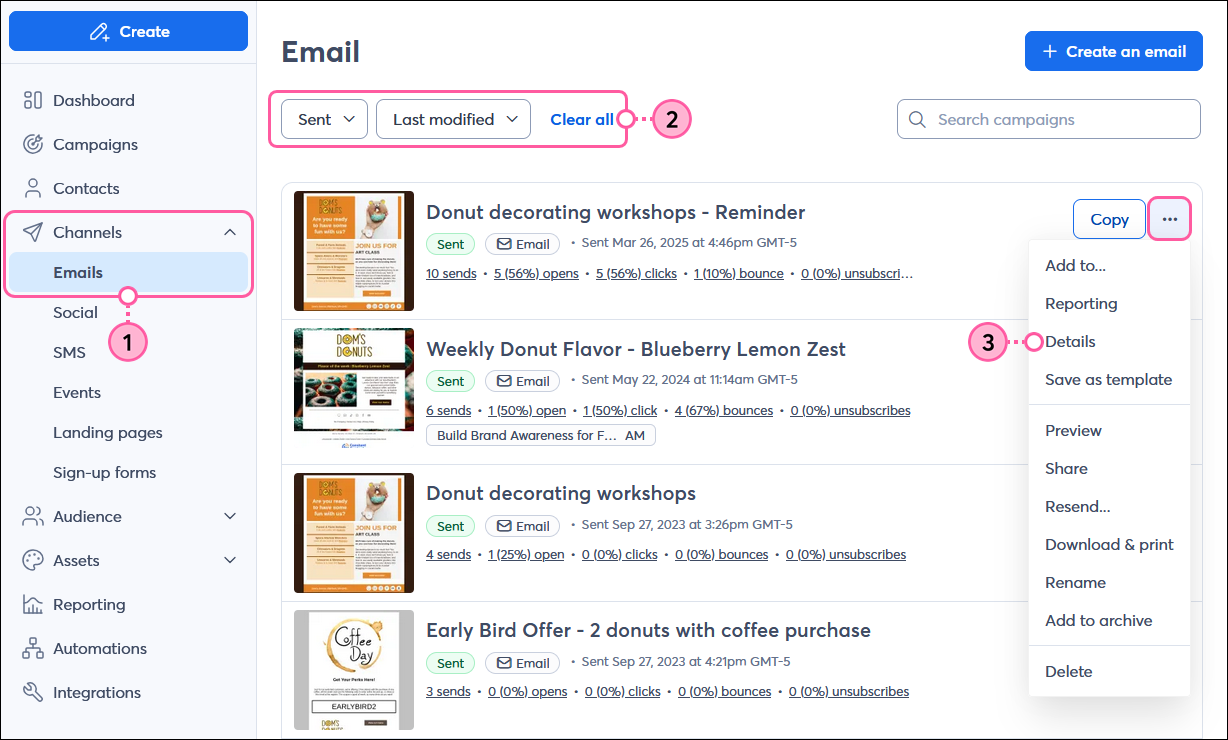
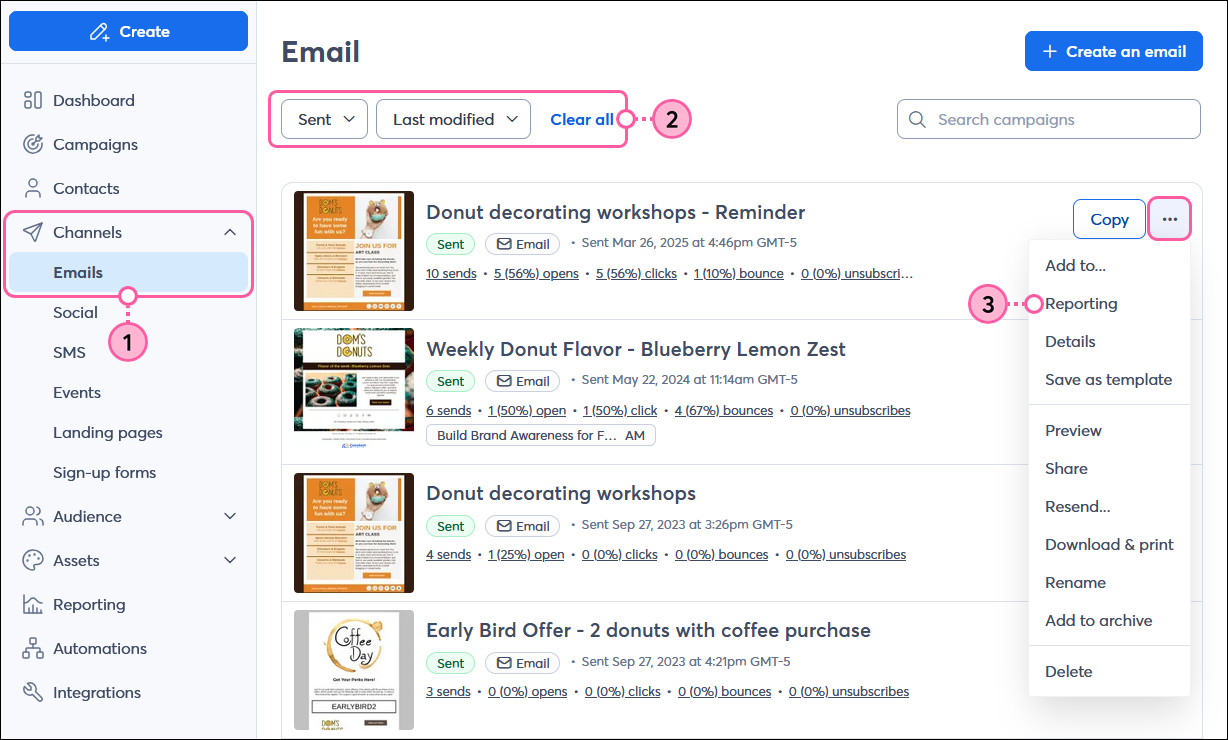
You've sent your email, but now what? A great next step is to review the details and reporting so you can gauge your success and help plan your next email campaign:
| Did you know? In addition to the Details and Reporting tabs, your sent email also features a Heatmap tab, allowing you to see where the most click activity occurs. |
Every sent email has its own Details page, where you can review what you sent to your contacts, see which contacts received the email, and access tools that let you share the email with more email contacts or with your social audience.
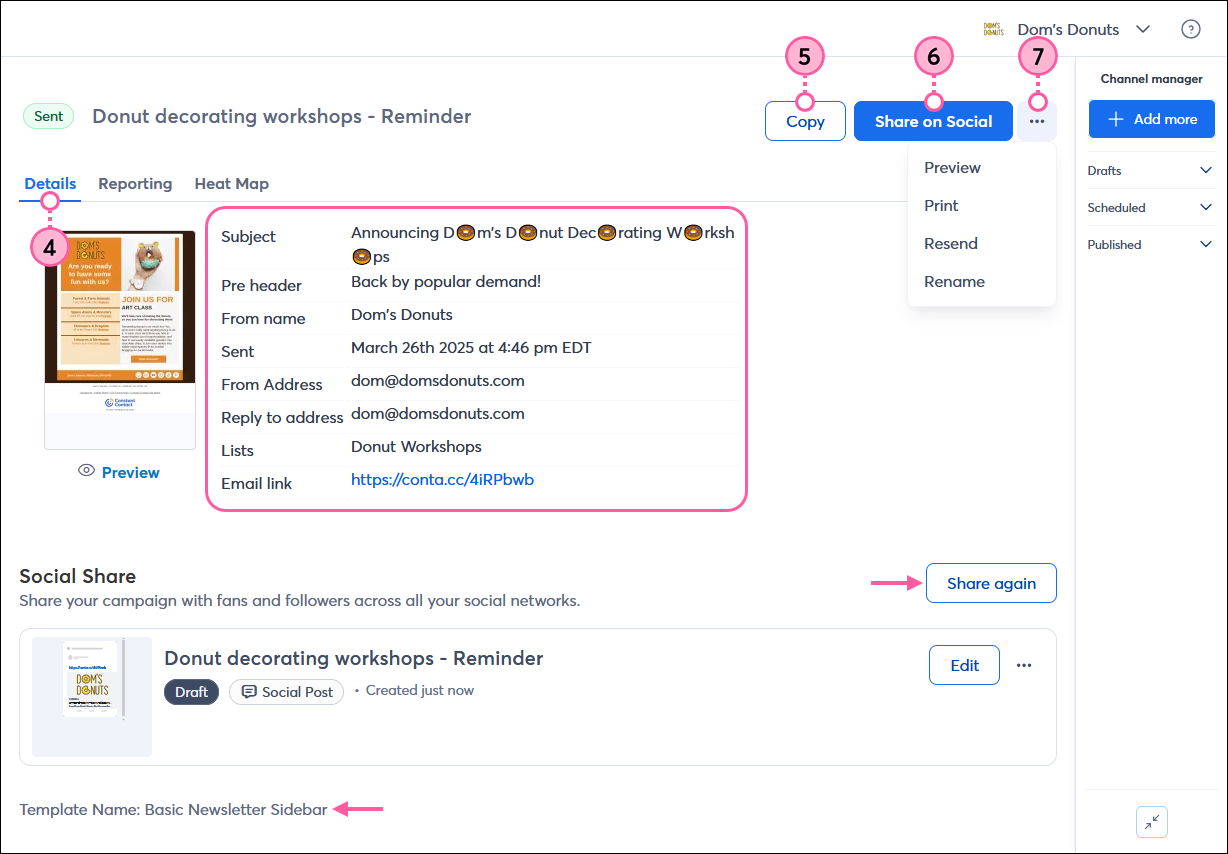
| Did you know? If you want create a new email using the same template for a previously sent email, you can find the template name at the bottom of the Details tab, then search for it when you select a template. |
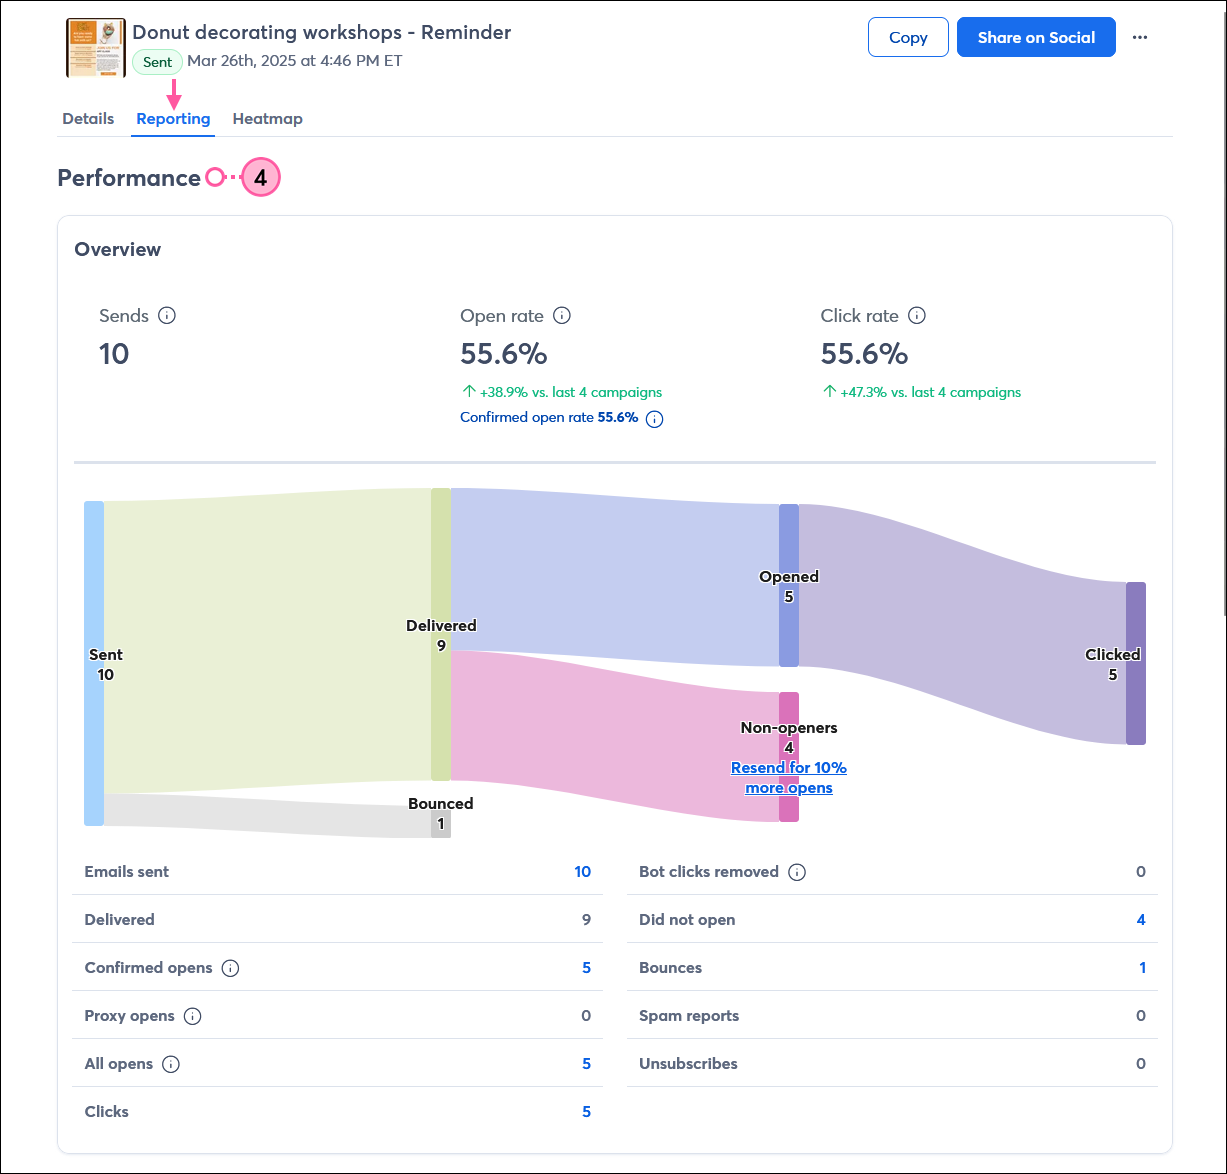
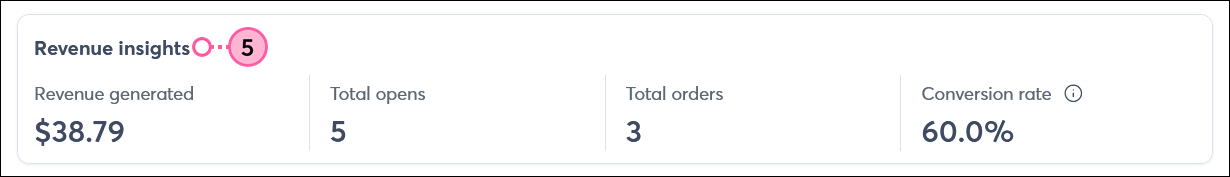
The Reporting page for your email shows you how it performed with the audience you sent it to and is packed with information to help you better understand what engages your audience.
Open rate = [ Unique opens / (Sends - Bounces) ] x 100
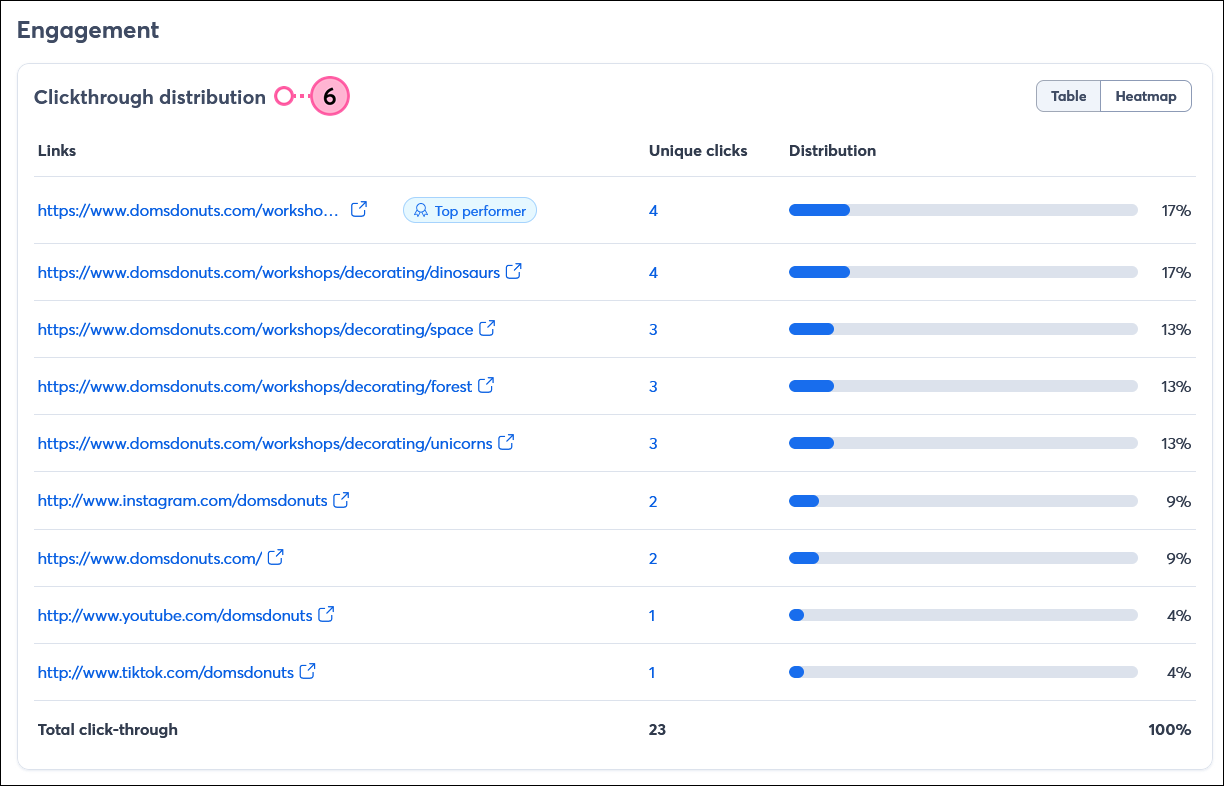
Click rate = [ Unique clicks / (Sends - Bounces) ] x 100
Delivered = Sends - Bounces
Conversion rate = (Orders / Opens) x 100
Distribution = (Unique Clicks / Total Click-throughs) x 100
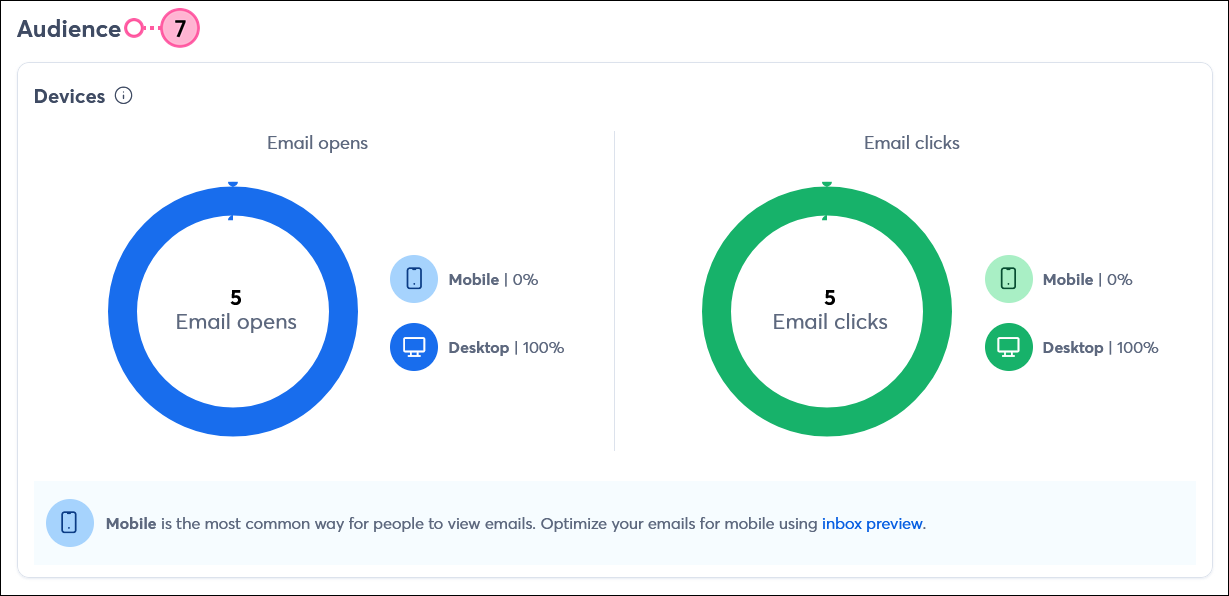
Desktop Open Percentage = (Number of desktop opens / Confirmed opens) ] x 100
Mobile Open Percentage = (Number of mobile opens / Confirmed opens) ] x 100
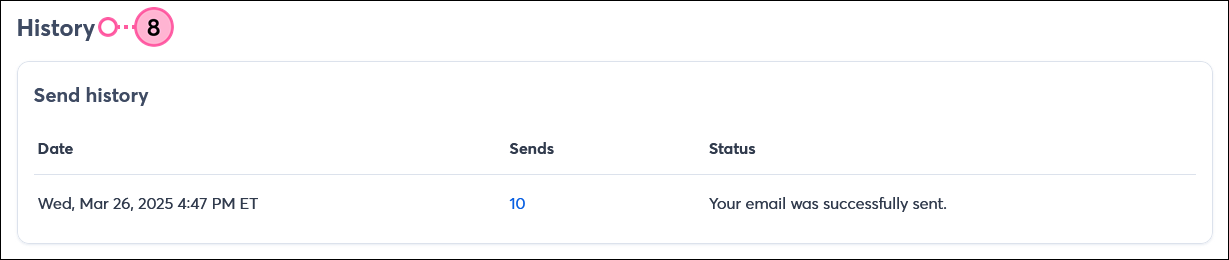
The Reporting tab may have additional information depending on the blocks added to the email layout or other tools used with your email:
| Did you know? If you want to see the bigger picture, you can review your overall email reporting and compare how your emails performed against each other from the Reporting tab in the left-hand menu. |
Copyright © 2026 · All Rights Reserved · Constant Contact · Privacy Center