Email and Digital Marketing
How can we help you?
Search our help articles, video tutorials, and quickstart guides

You've got this. You've got us. Search our Knowledge Base to quickly find answers to your questions.

Teams: View Campaign Reporting

Article: 000055231
Updated: June 12, 2026

Take a look at campaign performance across the entire organization in a single, aggregated view

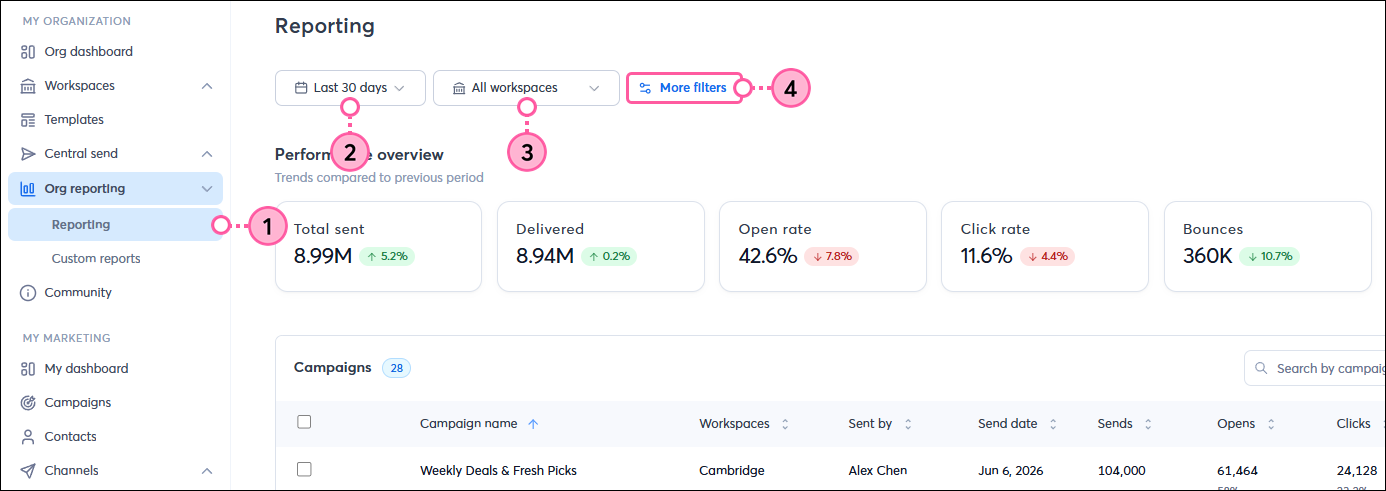
On the Email Reporting dashboard, see campaign performance at a glance without having to impersonate each of your workspaces. Select a time frame, and view your entire organization's performance or drill into one or more workspaces to see filtered, location-specific data.


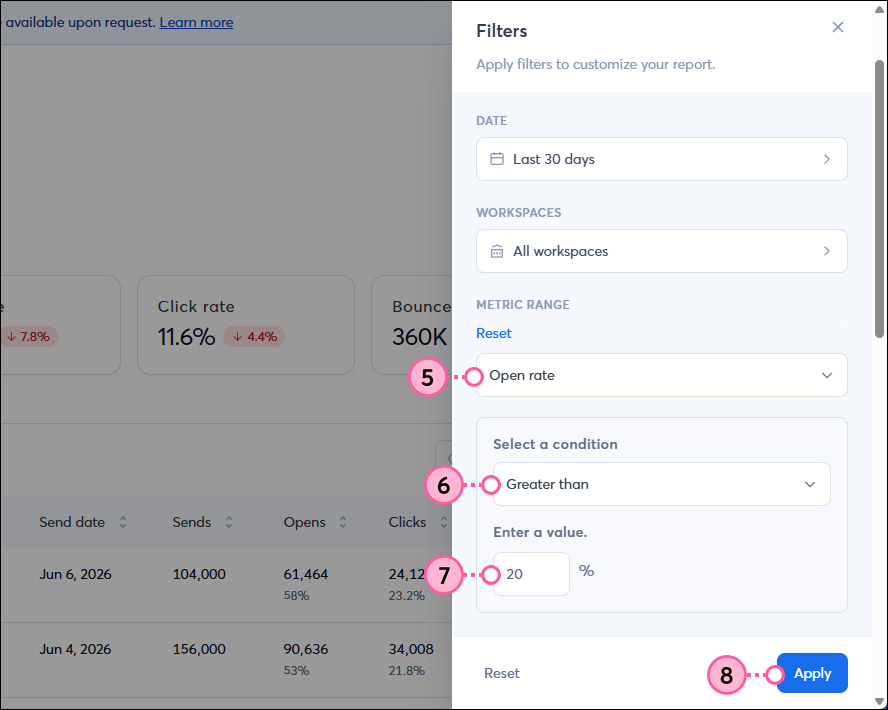
Automatically compare data to previous date ranges, and identify underperforming campaigns, such as "opens below 15%" with metric thresholds. 


To access the Reporting dashboard:

  1. Click Org reporting > Reporting.
  2. Select a date range to view.
  3. View data for all of your workspaces or select specific workspaces from the dropdown.
  4. Optionally, click "More filters" to select a metric threshold.

    Reporting dashboard time frame and workspaces dropdowns more filters option

  5. Select a metric from the dropdown - either open rate, click rate, bounce rate, or unsubscribe rate.
  6. Select a condition from the dropdown - either equals, greater than, less than, or between.
  7. Enter the value(s) to use as a threshold.
  8. Click Apply.

    Reporting Dashboard filters

  9. In the Performance Overview section, see high-level metrics for the selected time period, account(s), and filter. Additionally, for each metric, you can see a comparison to the previous time frame. 
    • Total sent - The total number of contacts you’ve sent emails to. These stats do not include emails that were resent.
    • Delivered - The total number of emails that were successfully delivered to your contacts.
      (Emails sent - Bounced = Delivered)
    • Open rate - The percentage of email sends that resulted in email opens.
    • Click rate - The percentage of email sends that resulted in link clicks.
    • [Unique clicks / (Sends - Bounces)] x 100
    • Bounced - The total number of emails that bounced.
    • Unsubscribed - The total number of contacts who unsubscribed.
  10. Below the Performance Overview section, you'll see the Campaigns table. The campaigns listed match your selected time period, accounts, and filter. For each campaign, you can view the:
    • Campaign name - This is the campaign name along with the send date and time.
    • Account name - The account that sent the campaign.
    • Sends - This is the total number of contacts the email was sent to.
    • Opens - This shows both the total number of unique opens for your email and the open rate.
    • Clicks - This shows both the total number of unique clicks the links in the email received and the click rate.
    • Bounces - This shows both the total number of bounces and the bounce rate for the email.
    • Unsubscribes - This shows both the total number of unsubscribed contacts and the unsubscribe rate for the email.
  11. Click "View details" to be brought to the campaign's Email Details and Reporting page.
  12. Optionally, to export the campaign data as a CSV, checkmark one or more campaigns and then click Export selected.

    Reporting Dashboard Overview, Campaign Data, Export


Questions?

Ask the Community

Did this article answer your question?


Constant Contact Logo

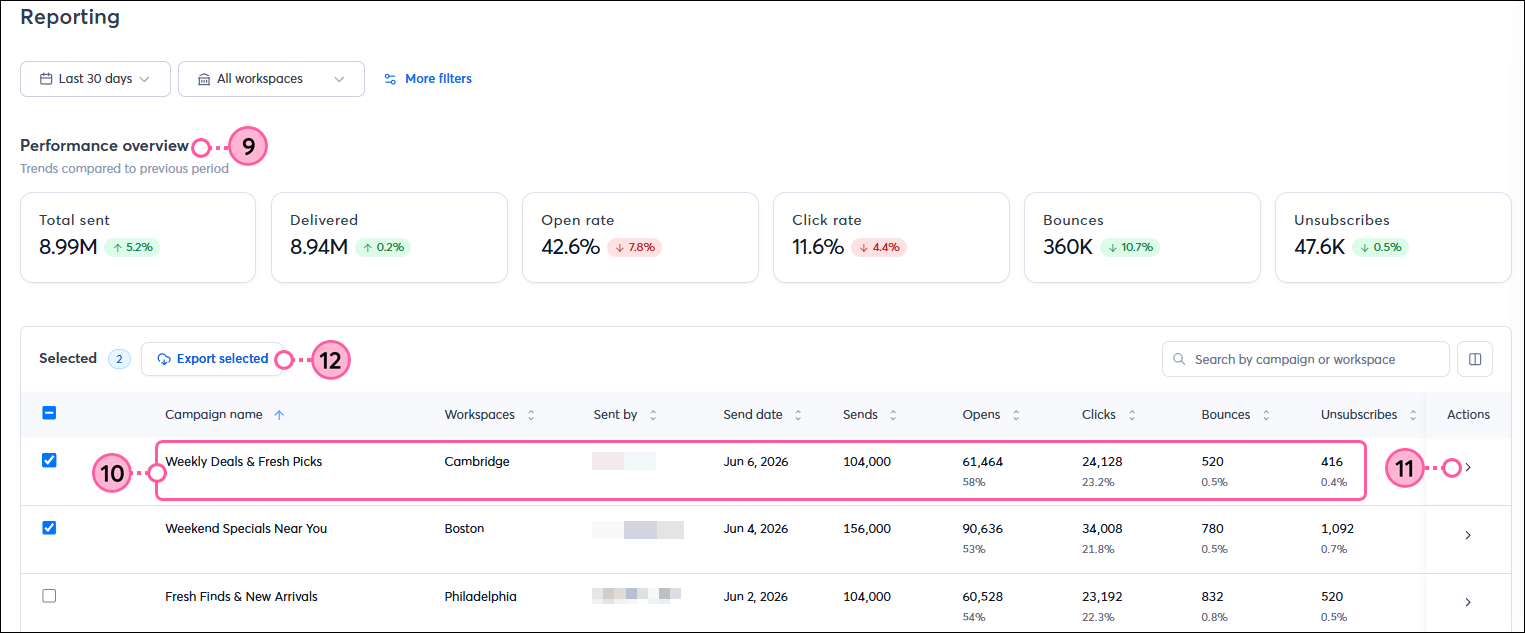
Copyright © 2026 · All Rights Reserved · Constant Contact · Privacy Center