We're making it easier to get around Constant Contact with a brand new left navigation. Not all accounts have that change yet, so if your navigation looks different from our articles, that's why–but everything from the top can now be found on the left!

Email and Digital Marketing
How can we help you?
Search our help articles, video tutorials, and quickstart guides

You've got this. You've got us. Search our Knowledge Base to quickly find answers to your questions.

View your email reporting

Article: 000053004
Updated: May 2, 2025

Check your email performance over time, see your top-performing emails and links, and access the opens, clicks, bounces, and unsubscribes for each email you send

Exclamation Point IconImportant: This article pertains to customers in our Lite, Standard, and Premium plans. If you're on one of our other email plans, please reference this article instead.


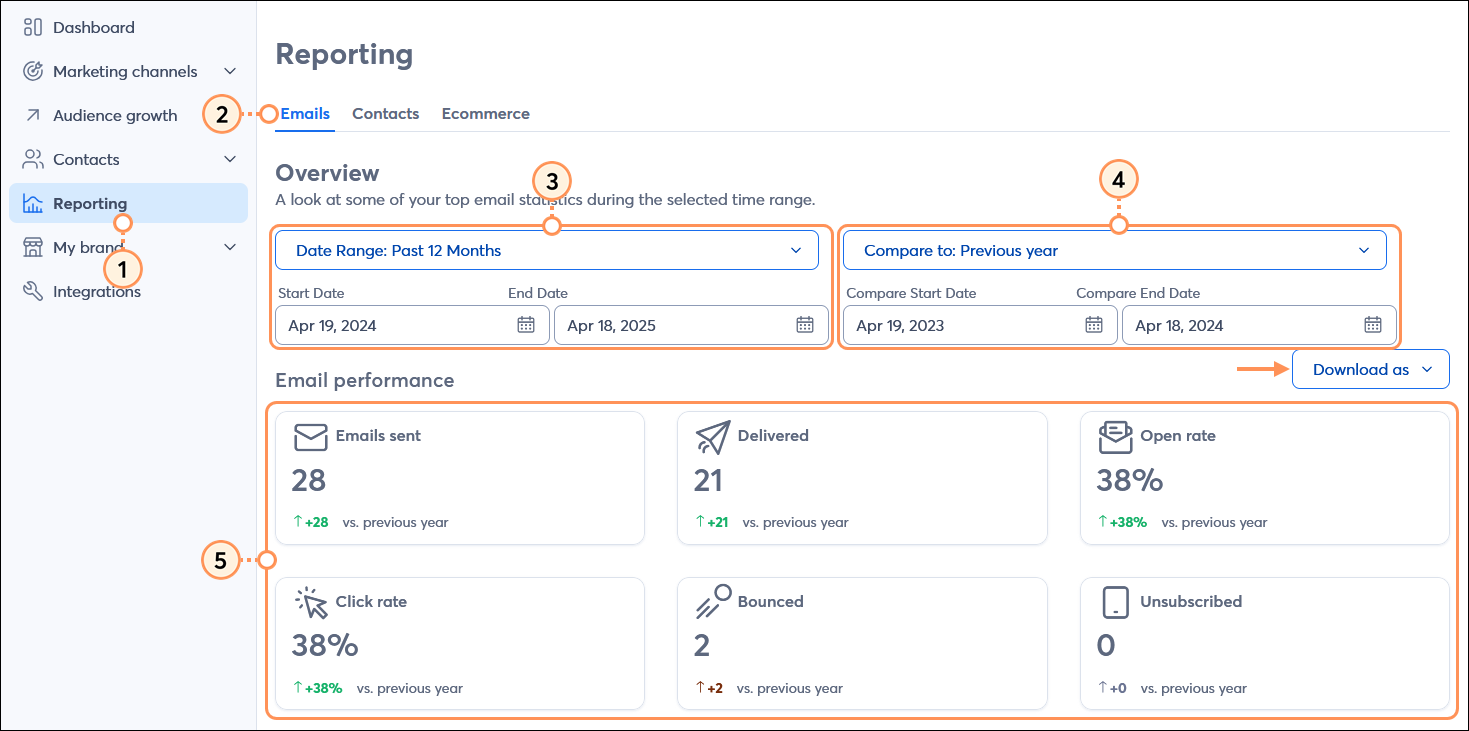
Your email reporting gives you the full picture of how your emails are performing, right down to your best-performing links. Checking your overall performance helps you spot trends so you can see what's working and where you might want to change things up.


Email Plus IconReview your plan: These reporting features are not available in all Constant Contact plans. If you don't have full access, you may need to upgrade your plan.


Get an overview

  The email report is flexible, allowing you to select a timeframe to compare your results to the previous period, year, or custom date range. In addition, your report can be downloaded as a PDF or CSV.

  1. From the menu on the left-hand side, click the Reporting tab.
  2. Click the Emails tab.
  3. Select a Date Range for your reporting from the drop-down menus, or enter a custom date range.
  4. Select a timeframe from the Compare to drop-down menus or enter a custom date range. Selecting "Previous period" matches the timeframe you select for your reporting. For example, if you choose to view your reporting for the past 30 days, the previous period would be for the 30 days prior.
  5. In the Email performance section, review your:
  • Emails sent - The total number of contacts you’ve sent emails to in the specified time period. These stats do not include emails that were resent. 
  • Delivered - The total number of emails that were successfully delivered to your contacts during the specified time period.
    (Emails sent - Bounced = Delivered)
  • Open rate - The percentage of email sends that resulted in email opens during the specified time period.
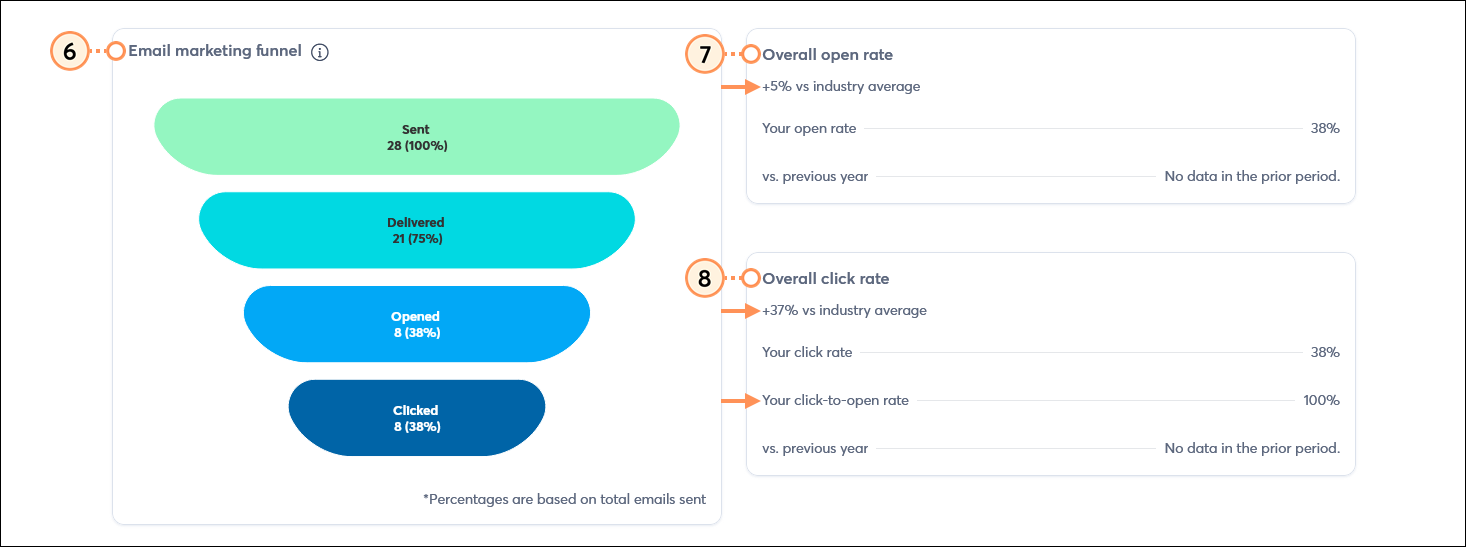
    [Unique opens / (Sends - Bounces)] x 100
  • Click rate - The percentage of email sends that resulted in link clicks during the specified time period.
    [Unique clicks / (Sends - Bounces)] x 100
  • Bounced - The total number of emails that bounced during the specified time period.
  • Unsubscribed - The total number of contacts who unsubscribed during the specified time period.
  • Conversion rate - The percentage of email sends that resulted in orders during the specified time period, if you have an ecommerce store connected to your Constant Contact account. If you don't have any purchases, this metric isn't displayed.
    [Purchases / (Emails sent - Bounces)] x 100
  • Total sales - The total revenue generated from your email efforts during the specified time period, if you have an ecommerce store connected to your Constant Contact account. If you don't have any purchases, this metric isn't displayed.

    Reporting tab and Reporting dashboard with Emails tab selected, Overview section with Date Range options and Compare to options, Email performance section, and Download as button

  1. The Email marketing funnel graph shows the stages of your emails' journey, from the time you send them to when a contact engages with them. The number of sent emails is usually equal to or greater than the number of delivered emails because a few may bounce. Emails that are delivered may go unopened, so it's also normal for the number of opened emails to be smaller than the number of delivered emails. Then finally, not everyone who opens your email will engage with the links and buttons, so it's also fine when there are fewer links clicked than emails opened.
  2. The Overall open rate shows you the average open rate during the selected time period. If you added an industry to your account settings, you can also see how well you're performing against the industry average.
  3. The Overall click rate shows you the average click rate during the selected time period and also compares it to your industry, if selected. In addition, your click-to-open rate (Unique clicks / Unique opens) is provided to give you a representation of your contacts' engagement.

    Email reporting with Email marketing funnel showing Sent, Delivered, Opened, and Clicked emails, the Overall open rate section, and the Overall click rate section

  4. The Opens by device shows you the percentage of unique opens performed on a mobile device compared to a desktop computer during the specified time period.
    Note: The Email Details page includes the percentage of unique mobile and desktop opens specific to each sent email.
  5. The Clicks by device shows you the percentage of unique clicks that were made on a mobile device compared to a desktop computer during the specified time period.

    Email reporting with Opens by device and Clicks by device pie charts with Mobile and Desktop percentages

  6. View your three top and low-performing email campaigns by Open Rate or Click Rate, using the drop-down menu to toggle between the options. Clicking on the hyperlinked email name lets you drill down into the unique report for each email.
  7. View your five top and low-performing links by Total Clicks or Unique Clicks, using the drop-down menu to toggle between the options. Clicking on the hyperlinked email name lets you drill down into the unique report for each email.

    Email reporting with Top performing campaigns by Open Rate, Low performing campaigns by Open Rate, Top performing links by Total Clicks, and Low performing links by Total Clicks


View your Email campaign reports

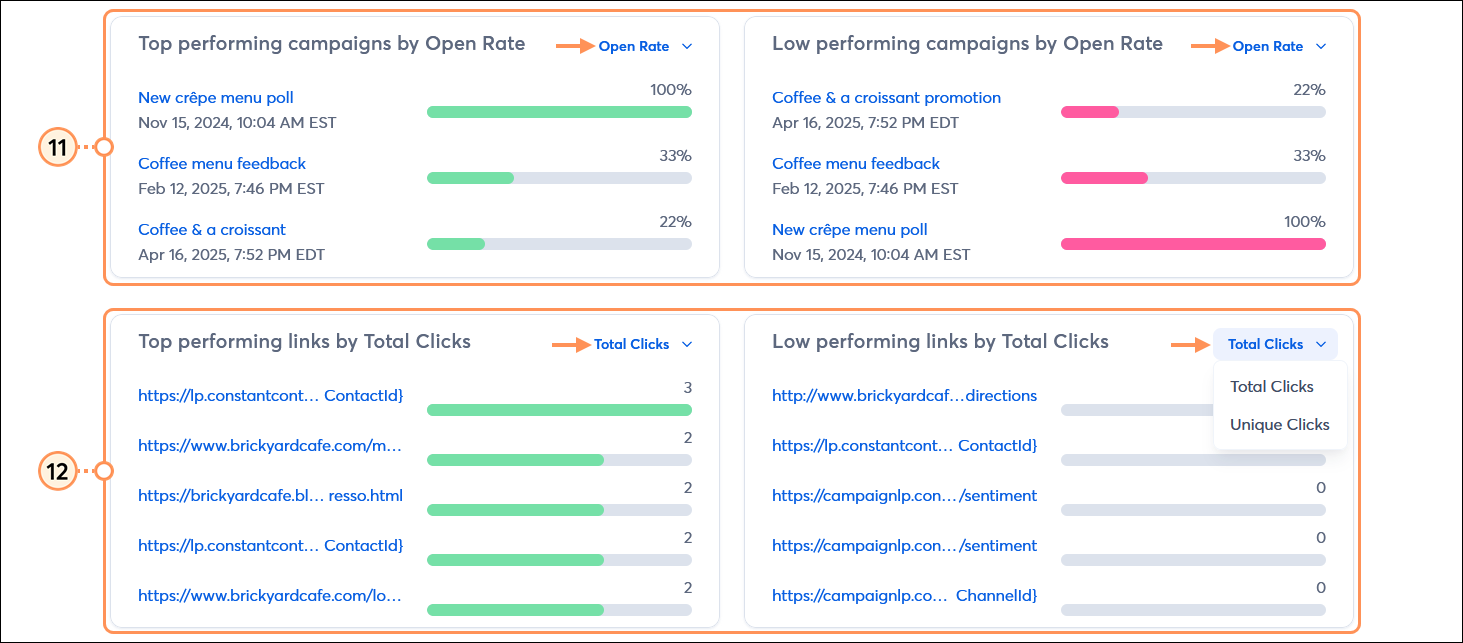
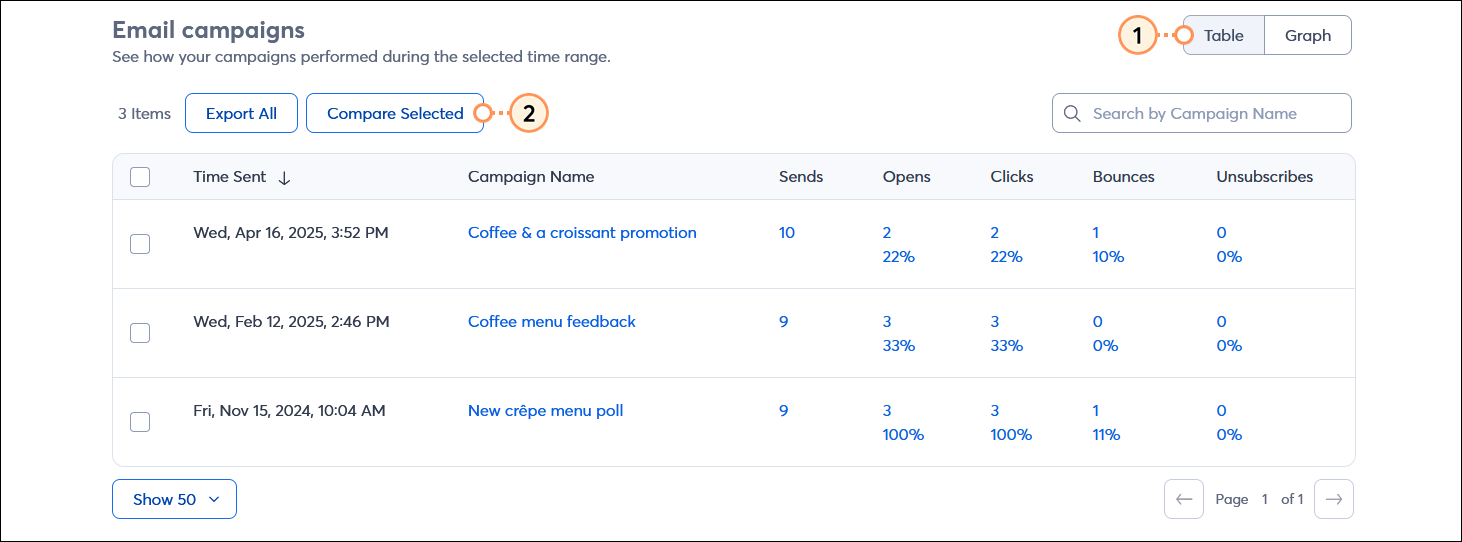
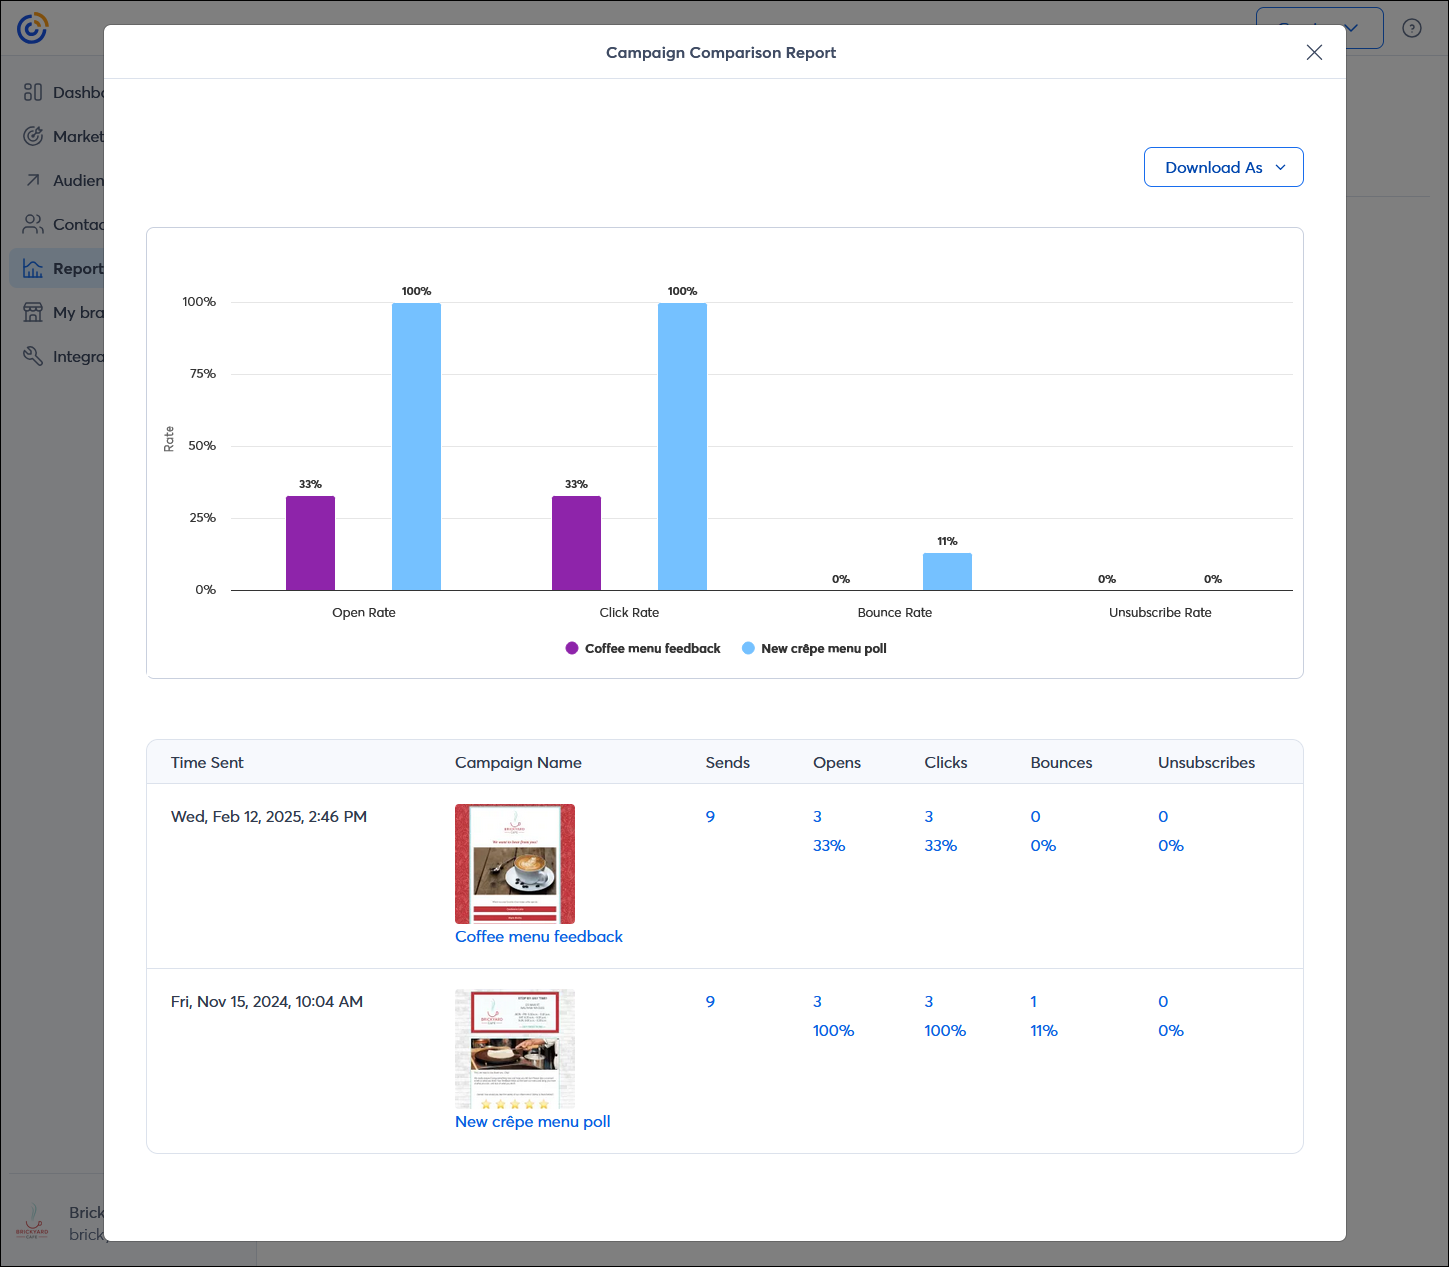
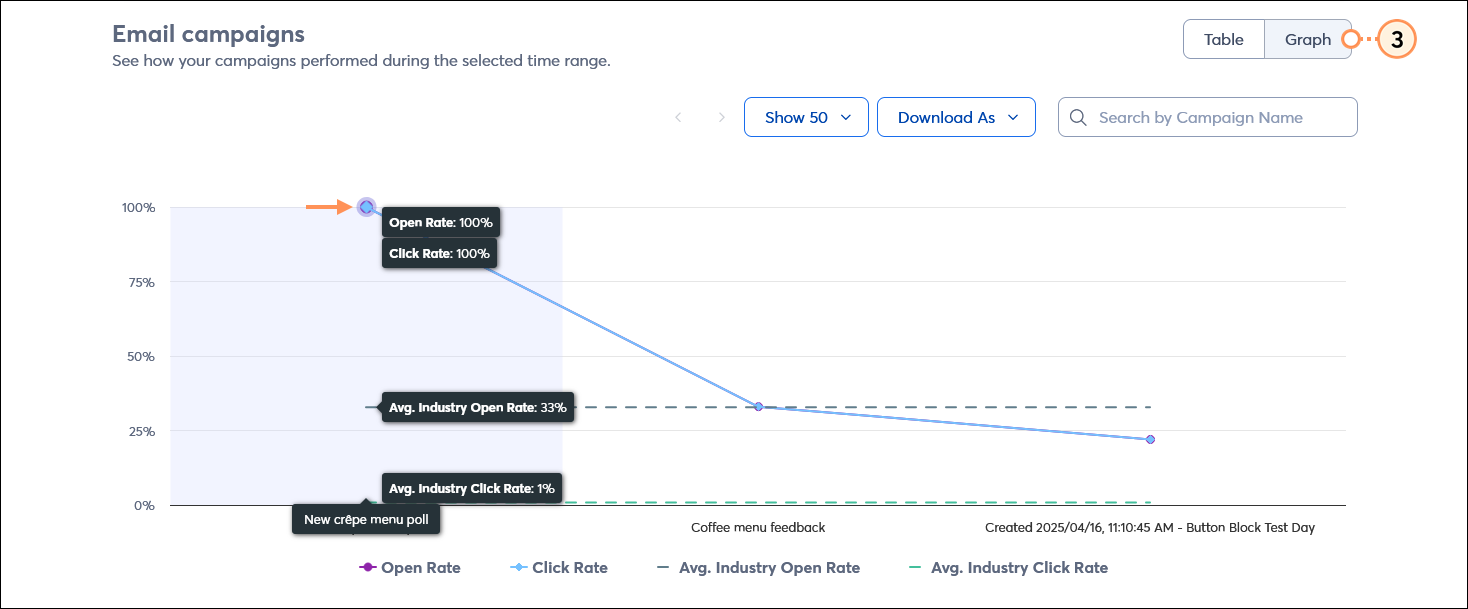
In the Email campaigns section, you can see a list of all the emails sent during your selected date range. You can see how your emails perform against each other and your chosen industry.

  1. Click the Table button. Your campaigns report can be exported as a CSV by clicking the Export All button or selecting specific emails and clicking the Export Selected button.
  • Campaign Name - Clicking the hyperlinked email name brings you to its unique Email Details page.
  • Sends - This is the total number of contacts your email was sent to. Clicking the hyperlinked number will bring you to the email's Sent report.
  • Opens - This shows both the total number of unique opens for your email and the open rate. Clicking on either hyperlinked number brings you to the email's Opened report.
  • Clicks - This shows both the total number of unique clicks the links in your emails received and the click rate. Clicking on either hyperlinked number brings you to the email's Clicked report.
  • Bounces - This shows both the total number of bounces and the bounce rate for your email. Clicking on either hyperlinked number takes you to the email's Bounced report.
  • Unsubscribes - This shows both the total number of unsubscribed contacts and the unsubscribe rate for your email. Clicking on either hyperlinked number takes you to the email's Unsubscribed report.

    Email campaigns section with Table option selected and email table with Sends, Opens, Clicks, Bounces, and Unsubscribes, and Compare Selected button
     
  1. Click the Compare Selected button. From the Campaign Comparison Report, you can choose between 2 and 5 campaigns to compare at a time. The report compares your sends, opens, clicks, bounces, and unsubscribes in both a bar graph where the emails are compared side-by-side, and in a table that includes the totals and rates.

    Campaign Comparison Report with two emails selected

  2. Click the Graph button. Your email campaigns are plotted along a timeline so you can see the increases and decreases of your open and click rates compared to the average open and click rates for your chosen industry. Placing your cursor over each dot in the line graph tells you the email name and the open and click rate for the specific email. You can export your graph by clicking the Download As button and selecting the PNG, JPG, SVG, PDF, or CSV option.

    Email campaigns section with Graph option selected withOpen Rate, Click Rate, Average Industry Open Rate, Average Industry Click Rate displayed


Improve your results

Now that you understand what your reports are telling you, take a look at these suggestions to improve your email performance:

  • Open rates - If your email is being received but isn't being read, try these tips to improve your open rates.
  • Click rates - Simply opening your email isn’t enough. Help entice your subscribers to take action and improve your click rates with these tips.
  • Spam - Use industry best practices to reduce spam reports and keep your email inbox-worthy.
  • Deliverability - Follow these tips to improve your deliverability and help your email land in the inbox.


Light Bulb IconDid you know? Automated paths have their own reporting and aren't reflected on the Reporting tab. For information about the Contacts tab, see this help center article.


Want to learn more about improving your results? Watch our webinar:


Learn more about marketing and Constant Contact through our free live webinars.
 

Support IconSave time and achieve better results! Whether you want to get help with your strategy or are looking to outsource your marketing, we offer a variety of paid services to meet your needs. Get a free consultation to determine which marketing service is right for you. Rates start as low as $60/month. Request service consultation.


Questions?

Ask the Community

Did this article answer your question?


Constant Contact Logo

Copyright © 2025 · All Rights Reserved · Constant Contact · Privacy Center