Email and Digital Marketing
How can we help you?
Search our help articles, video tutorials, and quickstart guides

You've got this. You've got us. Search our Knowledge Base to quickly find answers to your questions.

Review your social analytics

Article: 000041612
Updated: October 15, 2025

View and download an overview of your social reach, audience growth, demographic, and location information for the last 7, 14, 30, or 60 days for your connected social profiles

Every time you share a social post, the post has unique reporting that shows you how your content performed. Still, your overall social analytics can help you better understand your audience and help inform your social media marketing strategy. Everything you need is found on the Analytics tab on the Social dashboard:

  1. In the menu on the left-hand side, click Channels > Social.
  2. Click the Analytics tab.
  3. In the Analytics section, you can compare any combination of your connected social profiles from the drop-down menu. Deselecting all of the profiles lets you compare all of them.
  4. Select a timeframe from the drop-down menu. You can choose from the last 7, 14, 30, or 60 days.
  5. Scroll down to:


Check your audience growth and engagement

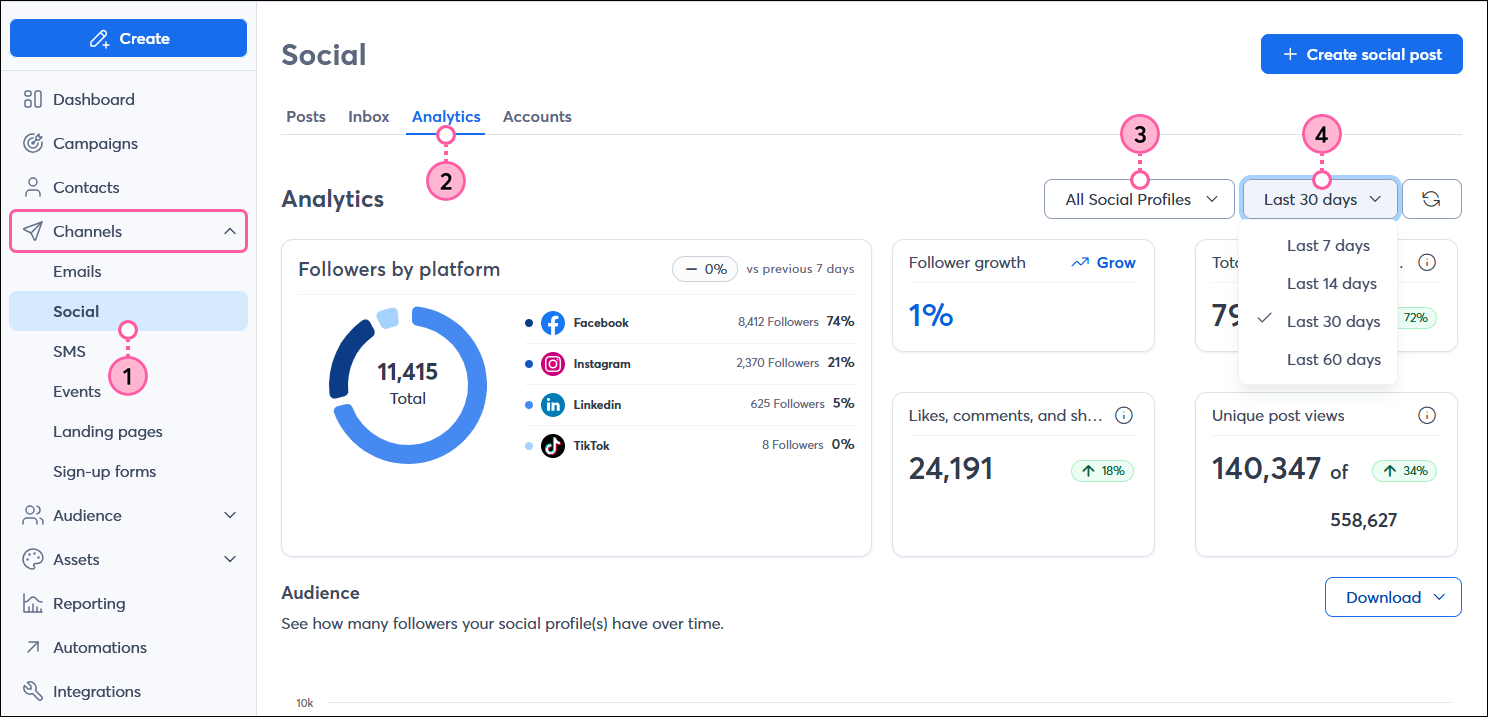
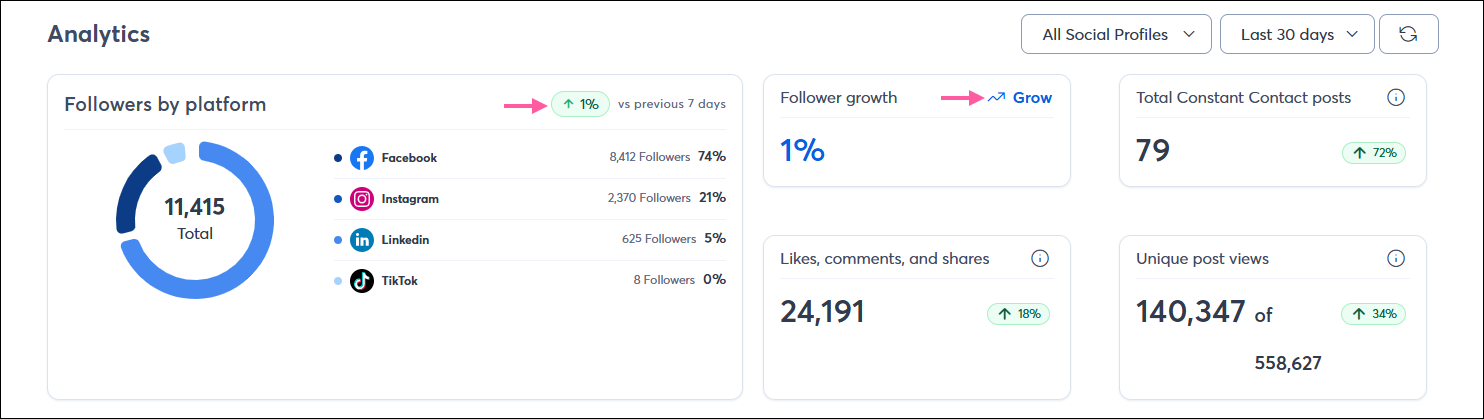
The Analytics section gives you an overview of your social audience's size, broken down by platform, growth over time, and engagement. This allows you to see how well your social posts are helping to retain and grow your audience. Your stats change depending on the timeframe you select from the drop-down menu.

  • Followers by platform - This shows you the total number of followers who have actively followed each of your connected social media profiles, what percentage they make up of your total following, and the percentage change in growth over the previous 7 days (this doesn't change when a new timeframe is selected).
  • Follower growth - Clicking the "Grow" link takes you to the Audience growth center, where you can increase your reach.
  • Total Constant Contact posts - This shows you the total number of posts you have successfully shared through your Constant Contact account. A post created with multiple social platforms selected counts as one post.
  • Likes, comments, and shares - This shows you the total number of likes, comments, and shares your posts received across all your connected social platforms, except LinkedIn.
  • Unique post views - This shows you the total number of unique people who viewed your post compared to the total number of times your post was viewed across all of your connected social platforms, except LinkedIn.

    Social page with Analytics section, Followers by platform with social platforms, Follower growth section with Grow link, Total Constant Contact posts section, Likes, Comments, and shares section, and Unique post views section


Compare your audience on each platform

The Audience section lets you compare the number of social followers you have over time so you can see where to focus your marketing efforts. If your audience is large on a specific platform, you know you need to spend time engaging with it, and if your audience is low, you know you need to focus on building it. Placing your cursor over any of the points in the graph (circles for Facebook, diamonds for Instagram, squares for LinkedIn, and triangles for TikTok) tells you the exact number of followers you had on that date.

Audience line graph with Facebook, Instagram, LinkedIn, and TikTok represented, and Download button


Bar chart icon
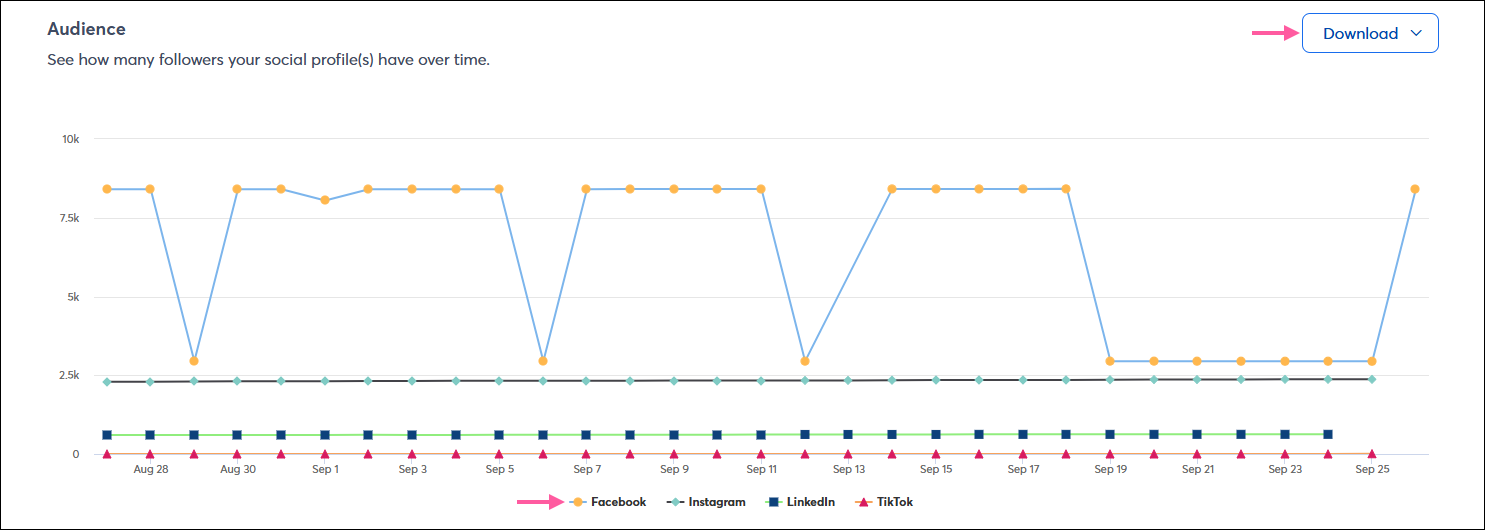
Need to share your data? Click the Download button to export your audience data as a PNG, JPG, SVG, PDF, or CSV file.


Review the age and gender demographics for your audience

Exclamation Point IconImportant: This section is only visible to those with at least 100 Instagram followers. Facebook, LinkedIn, and TikTok data are not currently available.


The Demographics Gender & Age section shows you the gender and age of your audience across your connected social platforms. The circle graph shows you your overall gender demographics. Placing your cursor over any part of the circle gives you the exact number of followers that fall into a gender category. The bar chart lets you compare your gender demographics by age. Placing your cursor over any portion of a bar shows you the exact number of followers in a gender category within an age group.

Demographic Gender & Age section with circle graph showing overall gender demographics, and bar chart showing gender demographics by age


Bar chart icon
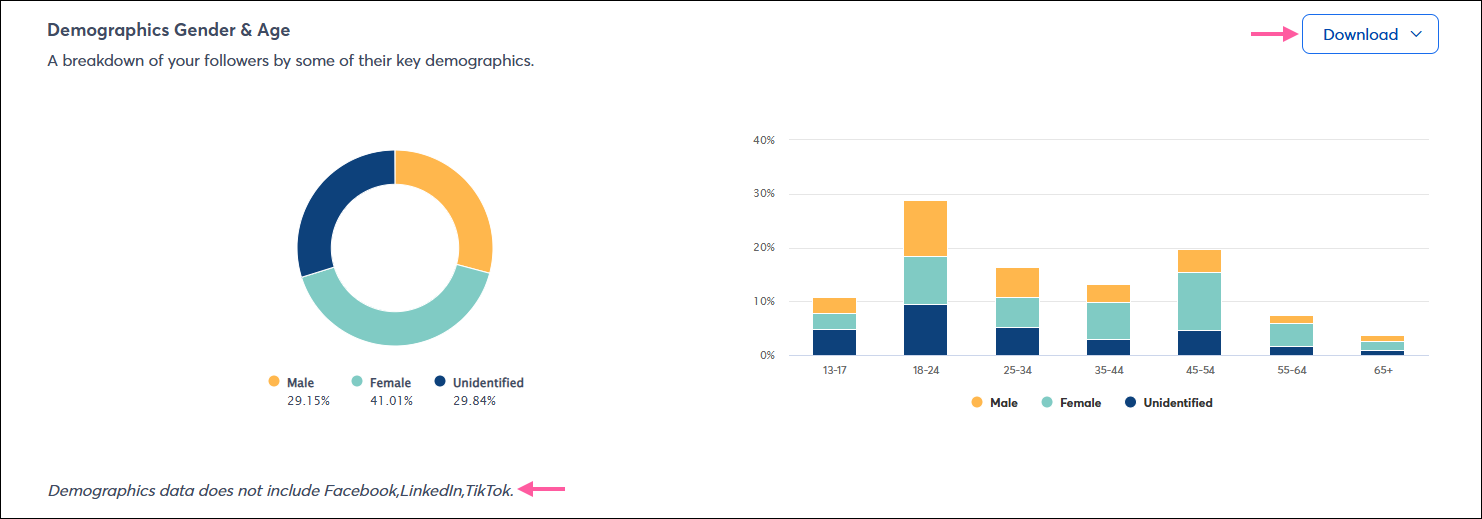
Need to share your data? Click the Download button to export your gender and age demographic data as a PNG, JPG, SVG, PDF, or CSV file.


See the top locations where your audience comes from

Exclamation Point IconImportant: This section is only visible when you have at least 100 followers on Facebook or Instagram. If you have Facebook and Instagram, but only one platform has 100 followers, the other isn't included in the statistics. LinkedIn and TikTok data are not available at this time.


The Top Locations section shows you where your audience lives and can help you decide on the type of content you create to better customize it for your audience.

  • Map view - This shows you where your audience is physically located. Use the + and - controls to zoom in and out of the map. You can toggle the map view between a world map and a map of the United States by clicking the See United States or See World button in the upper right-hand corner of the map. Placing your cursor over any highlighted country or state shows you the total number of followers and the percentage they make up of your audience.
  • By city - This shows a list of all the cities, from the largest to the smallest population, where your audience can be found. Click the Show more button to see the entire list.
  • By country - This shows you a list of all the countries, from greatest population to least, where your audience can be found. Click the Show more button to see the entire list.

    Top Locations section with world map displayed and See United States button and Download button, and locations listed by city and by country with Show more button


Bar chart icon
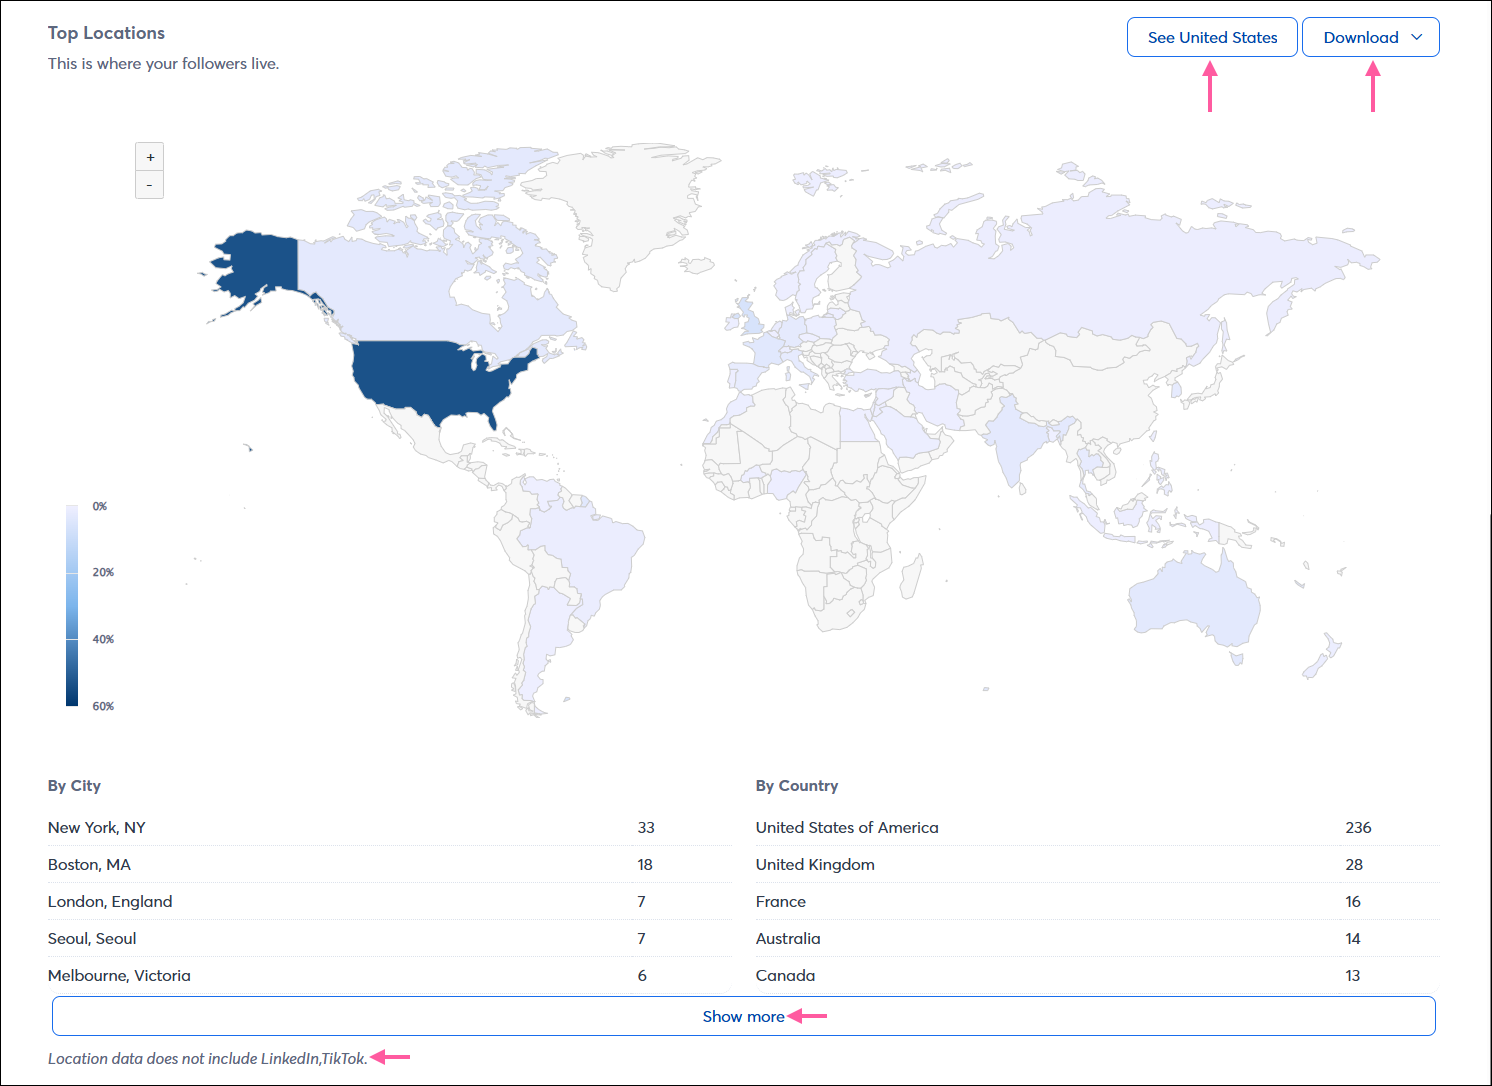
Need to share your data? Click the Download button to export your location data as a PNG, JPG, SVG, PDF, or CSV file.


Questions?

Ask the Community

Did this article answer your question?


Constant Contact Logo

Copyright © 2026 · All Rights Reserved · Constant Contact · Privacy Center