We're making it easier to get around Constant Contact with a brand new left navigation. Not all accounts have that change yet, so if your navigation looks different from our articles, that's why–but everything from the top can now be found on the left!

Email and Digital Marketing
How can we help you?
Search our help articles, video tutorials, and quickstart guides

You've got this. You've got us. Search our Knowledge Base to quickly find answers to your questions.

Reporting for a Survey Page

Article: 000039503
Updated: January 22, 2025

See how many people took your survey and view the responses


Email Plus IconReview your plan: This feature is not available in all Constant Contact plans. If you don’t have full access, you may need to upgrade your plan.


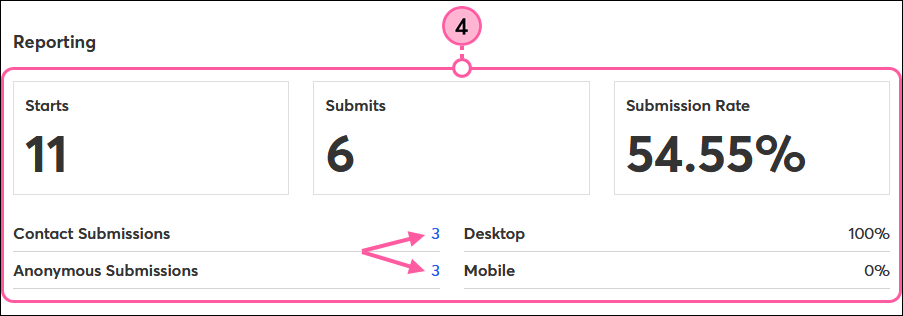
After you’ve activated your Survey Page, shared it with your audience, and started receiving responses, it’s time to view the results. Our reporting lets you see how many people started and completed your survey, view an overall summary of the results, and dig deeper into the individual responses. You can also segment your respondents to follow up with each group based on their feedback. 


View the results

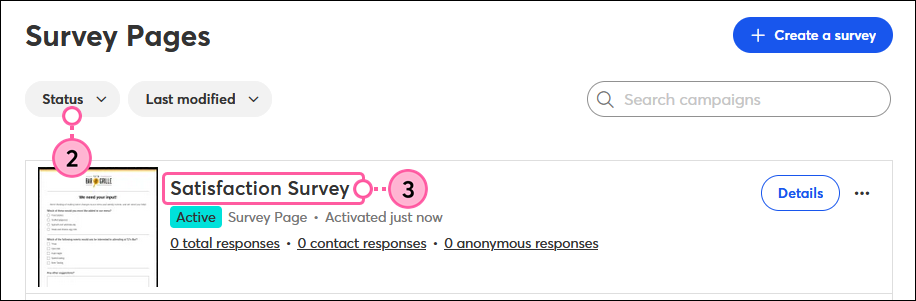
To view the reporting for your Survey Page:

  1. Click Marketing channels > Surveys.

    Campaigns tab, Campaigns drop-down with Surveys option, and Active Survey Page selected
     
  2. (Optional) Use the Status filter to narrow your search.
  3. Click on the name of your Survey Page.

    Surveys page, Status filter, and Active Survey Page selected
     
  4. Scroll down to the Reporting section to see the:
    • Starts - The number of people who clicked on the link for your survey.
    • Submits - The number of people who completed your survey.
      Note: Responses are only recorded when the respondent clicks the button at the end of your survey to submit it.
    • Submission Rate - The percentage of surveys that were started and resulted in a submission.
    • Contact Submissions - The number of people who completed your survey who are contacts in your account. Click on the hyperlinked number to see the specific contacts who responded to your survey.
    • Anonymous Submissions - The number of people who completed your survey who aren’t contacts in your account. Click on the hyperlinked number to see the anonymous responses.
      Light Bulb IconTip: To ensure responses from contacts aren't recorded as anonymous, be sure to share the link for your survey through a Constant Contact email. If a survey link is forwarded, it's recorded as an anonymous response.
    • Desktop - The percentage of surveys that were submitted from a desktop.
    • Mobile - The percentage of surveys that were submitted from a mobile device. 

      Reporting section with survey submission numbers
       
  5. Scroll down to the Overall Results section to see a summary of the responses received for each question. Click on the hyperlinked numbers to see who selected each answer option.
    Light Bulb Icon
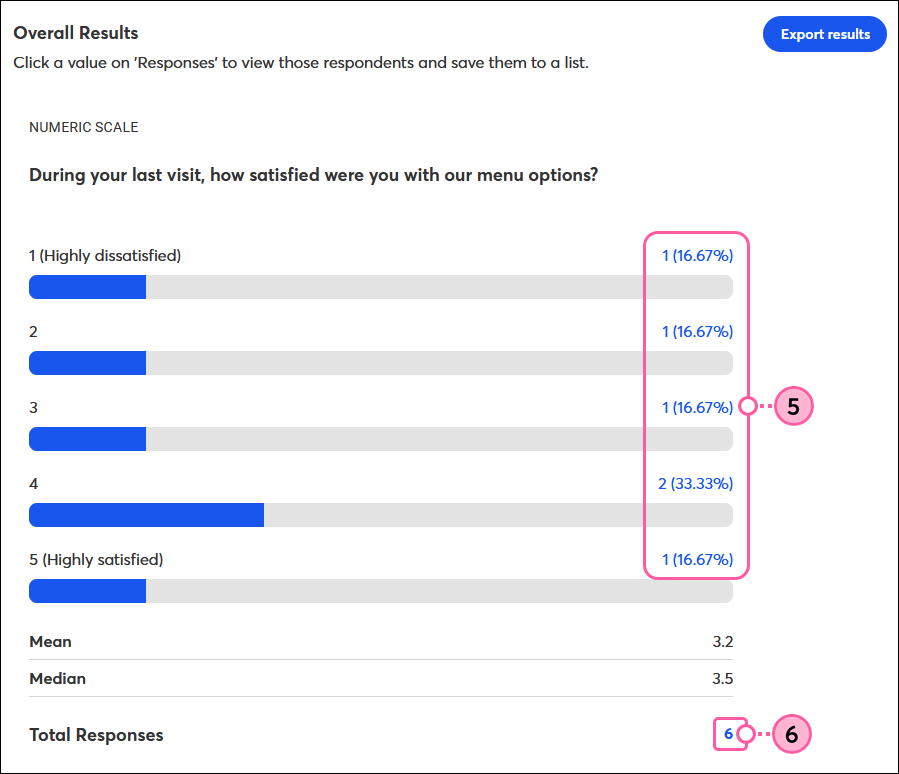
Tip: When viewing the individual responses for a question, you can add respondents to different email lists based on their answers so you can follow up with them later.
  6. Click the Total Responses hyperlinked number to see all the respondents who submitted an answer for that question.

    Overall Results section with individual and total response numbers, and Export All Results button
     
  7. Click the Export results button and select:
    • CSV - Export all results to download and save a spreadsheet of all the individual survey responses you received.
    • CSV - Export summary results to download and save a spreadsheet of the overall results for your survey.
    • PDF - Export summary results to download and save a PDF of the overall results for your survey in a graphical format.

      Overall Results section with individual and total response numbers, and Export All Results button


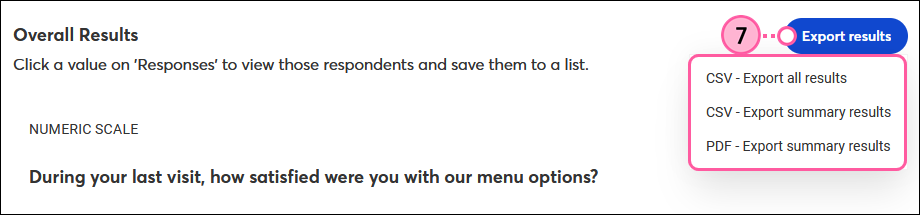
Check out some examples of the exported reports.


Analyze the results

For each question type, the results display a little differently. Here's how to read the results for each type:


Multiple choice and checkbox questions

For multiple choice and checkbox questions, you’ll see how many respondents selected each answer option and the total number of responses received for that question. If you included an “Other” answer option to let respondents type a response, you can click the hyperlinked number to view the individual answers submitted.
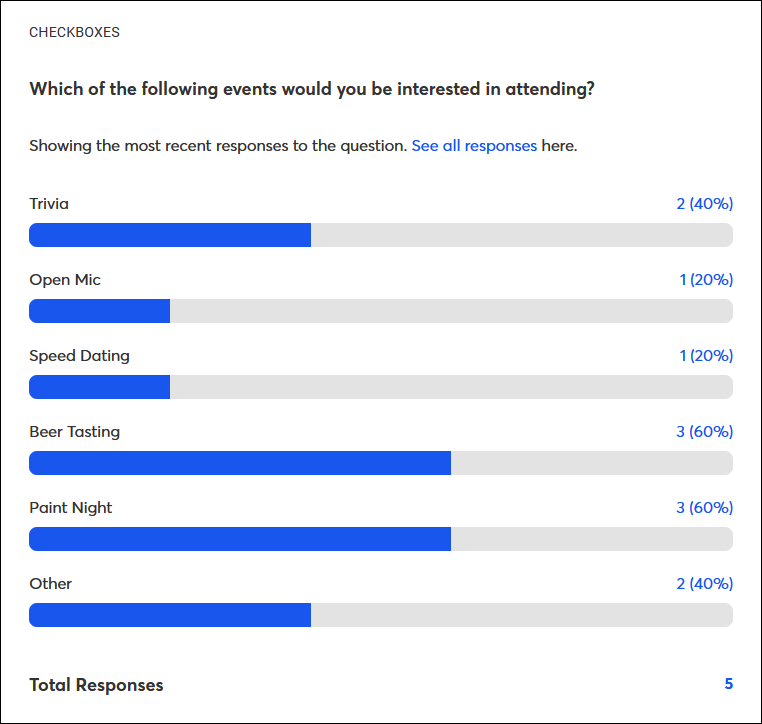
Example results for a checkbox question type


Open answer

For open answer questions, you’ll see each response given by your survey respondents and the total number of responses for the question.

Example results for an open answer question type


Rank order questions

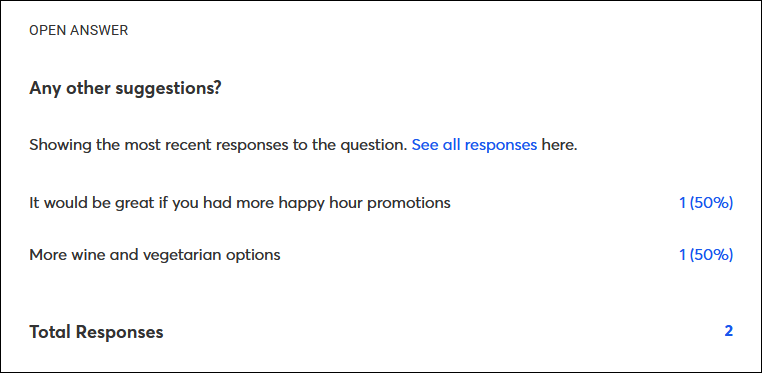
For rank order questions, each answer option is given a “Total score” based on how your respondents ranked it. The better the rank given by your respondents, the higher the score assigned. 

Example:
For a question with 3 options to rank, each #1 ranking is worth 3 points, each #2 ranking is worth 2 points, and each #3 ranking is worth 1 point. So for the example in the screenshot below, the total score for the fried pickles option is calculated as follows: (3 x 3) + (1 x 2) + (0 x 1) = 11.

Below the bar graph, you’ll see the average rank for each answer option and how many respondents ranked it at each level.

Example results for a rank order question type


Numeric scale

For numeric scale questions, you’ll see how many respondents selected each rating for that question and the mean (average) and median (middle) rating.
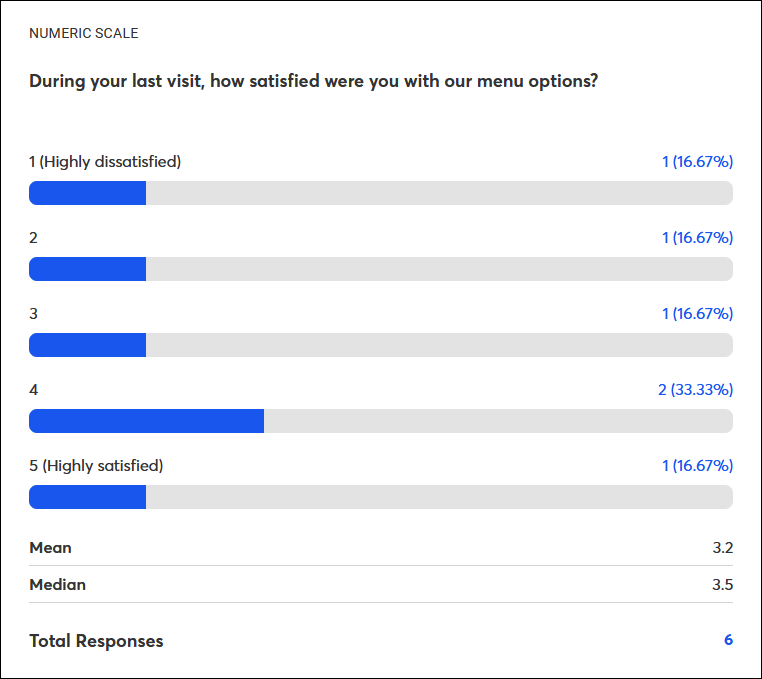
Example results for a numeric scale question type


Questions?

Ask the Community

Did this article answer your question?


Constant Contact Logo

Copyright © 2025 · All Rights Reserved · Constant Contact · Privacy Center