| Review your plan: Full access to this report is not available in all Constant Contact plans. If you don’t have full access, you may need to upgrade your plan. |
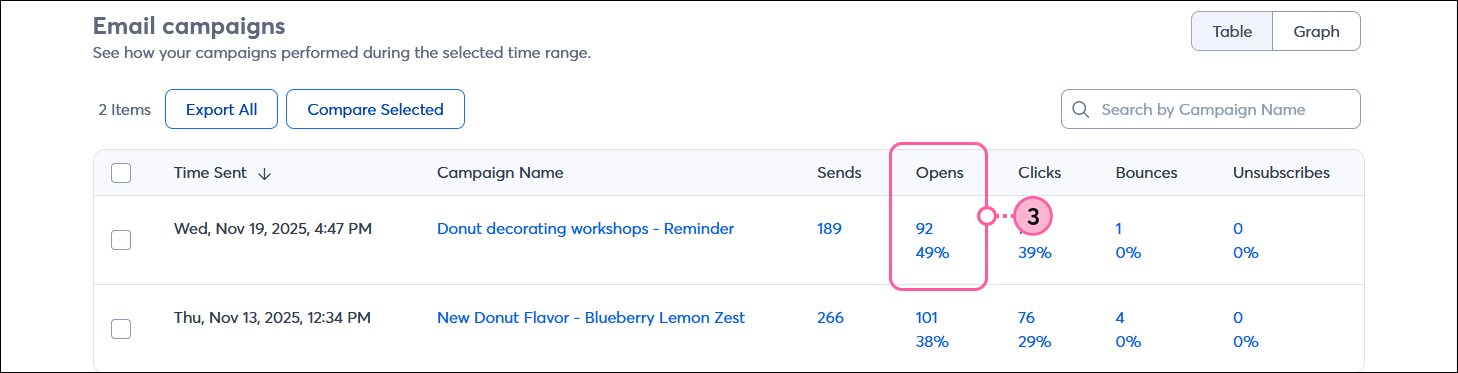
Your email opens are the first step in gauging your email engagement. You can compare the open rate for each email against each other to see which email performed better, and you can look deeper to see exactly which contacts are opening too. When you understand your opens, you can make more informed decisions about the type of content you're sending.
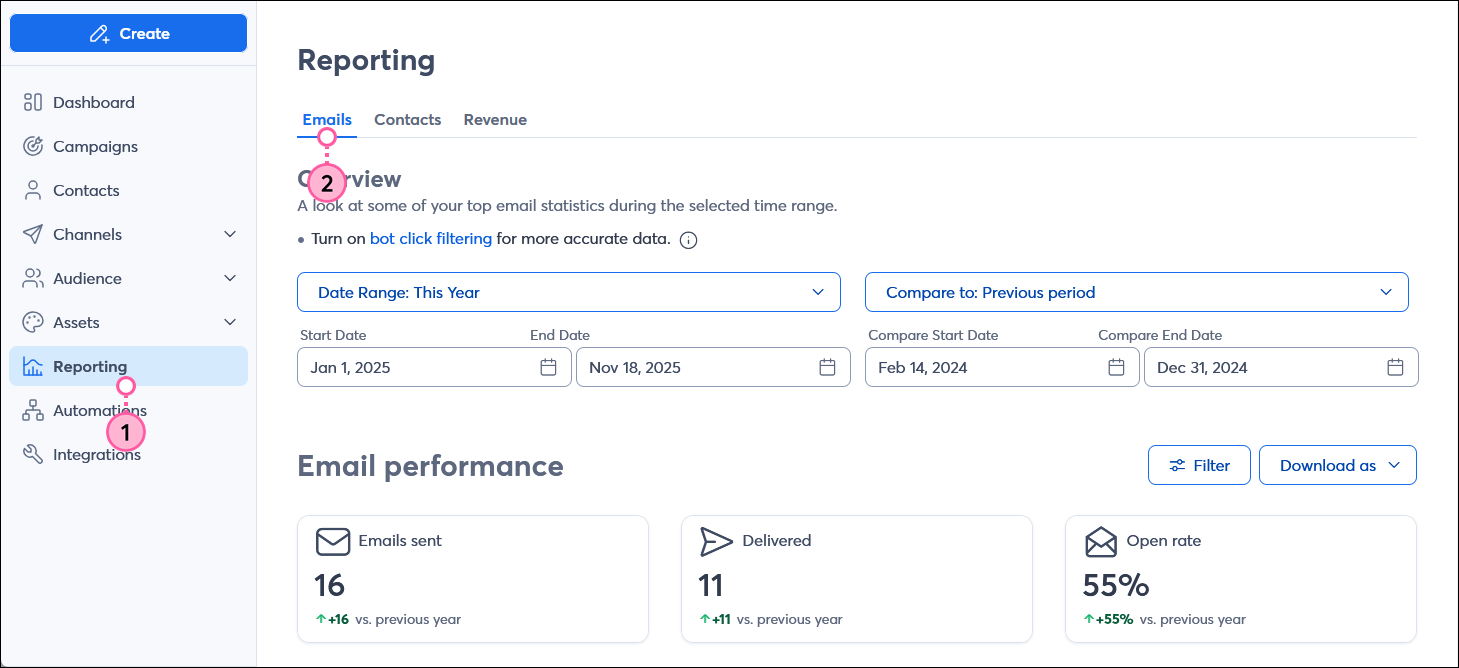
| Did you know? After you send an email, your opens information can be found in a couple of different places to give you some insight into how your email performed. The Email Details page shows you the opens for a specific email, and opens for all of your email campaigns, and other reports, like the clicks report, are found on the Reporting tab. |
An email's open rate is the percentage of contacts who opened your email compared to how many contacts were sent the email. The percentage of opens is calculated by dividing the number of unique opens by the number of emails sent, excluding the number of bounces. Each contact who opens the email is only counted once, even if that person opens it multiple times.
Open rate = [ Unique opens / (Sends - Bounces) ] x 100
You send an email to 5 contacts, 1 email bounces, and 2 contacts open the email. The open rate is calculated like this: Open rate = [ 2 unique opens / (5 emails sent - 1 bounced email) ] = 1/2, or 50%
| Did you know? Unique opens exclude any proxy opens that may have occurred through email security programs, and some opens can't be tracked at all. Learn more about factors that may affect your open rate. |
| Design tip: If you don't feel like your open rates stack up to the industry average, try these tips to help improve your email open rates. |
Copyright © 2026 · All Rights Reserved · Constant Contact · Privacy Center