It takes lots of work to grow your list, and you want to see what is working and what isn't so you can make better marketing decisions, focus on the best list growth tools for your organization, and optimize your marketing campaigns to increase engagement and reduce unsubscribes.
Desktip instructions
Mobile web instructions
Access the Contacts report
It's easy to access your reporting data:
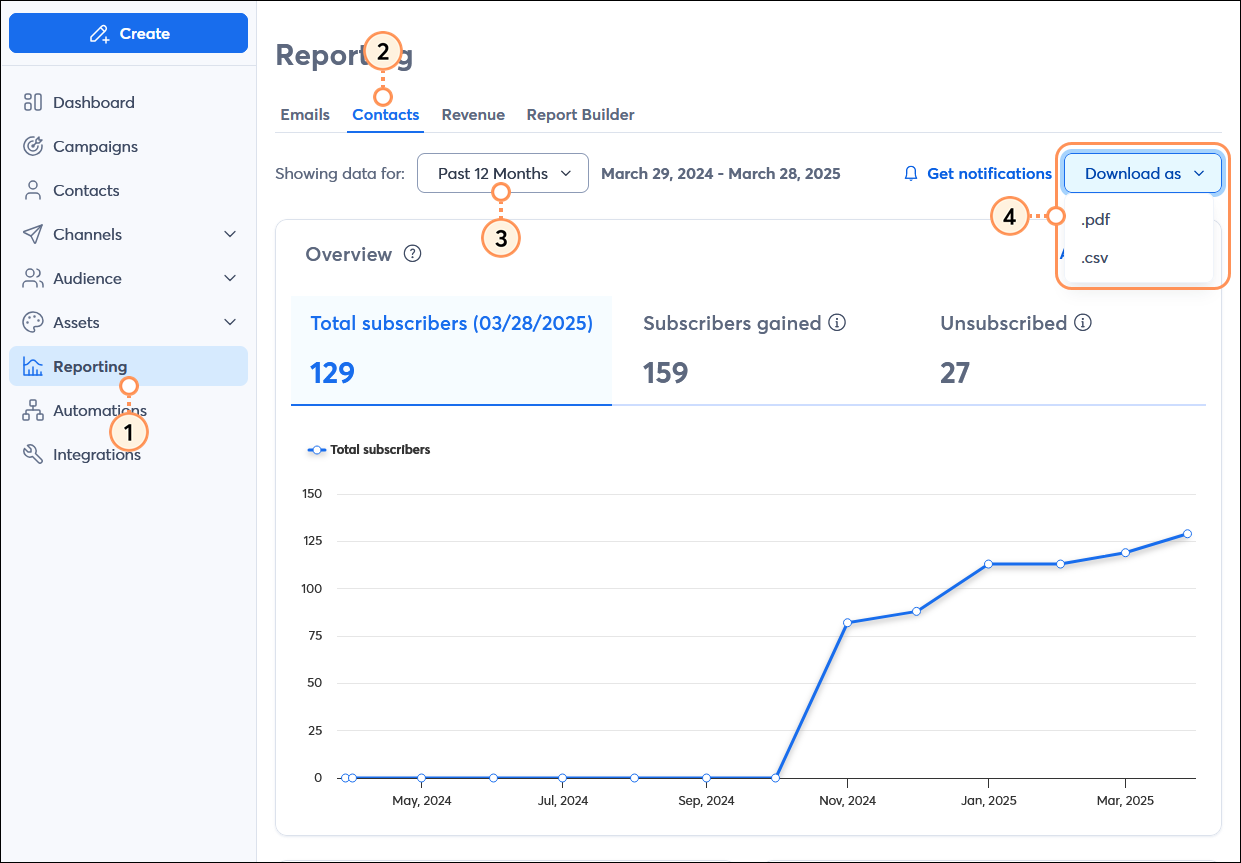
- In the menu on the left-hand side, click Reporting.
- Click the Contacts tab.
- Select the date range for your reporting. All of the reporting data updates based on what you select here. You can choose date ranges from between the past 7 days, up to the past 3 years, and create a custom range too.
- Click the Download as button and select the .pdf or .csv option. The PDF opens in a new tab and you can save the file, and the CSV file automatically downloads for you.
Get an overview
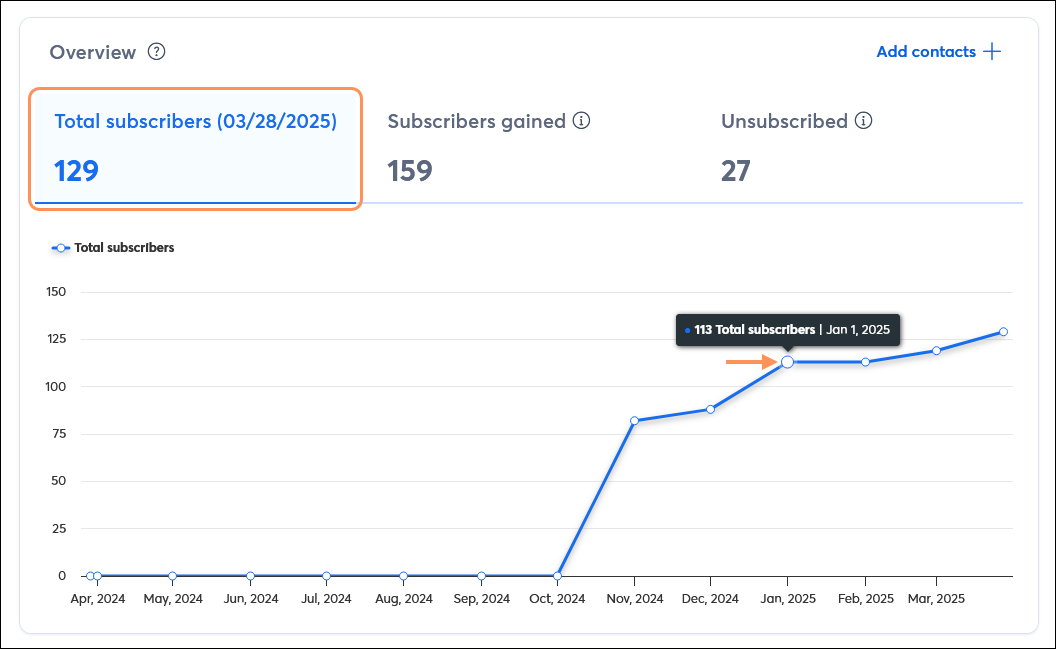
By clicking the tabs at the top of the Overview section, you can see trends over time, based on the date range you select:
- Total subscribers - This is the total number of active contacts in your account. Placing your cursor over the line graph shows the cumulative total of subscribers up to that point.
- Subscribers gained - This is the total number of new, active contacts added to your account, either through a sign-up tool or those that you added manually, within the given timeframe.

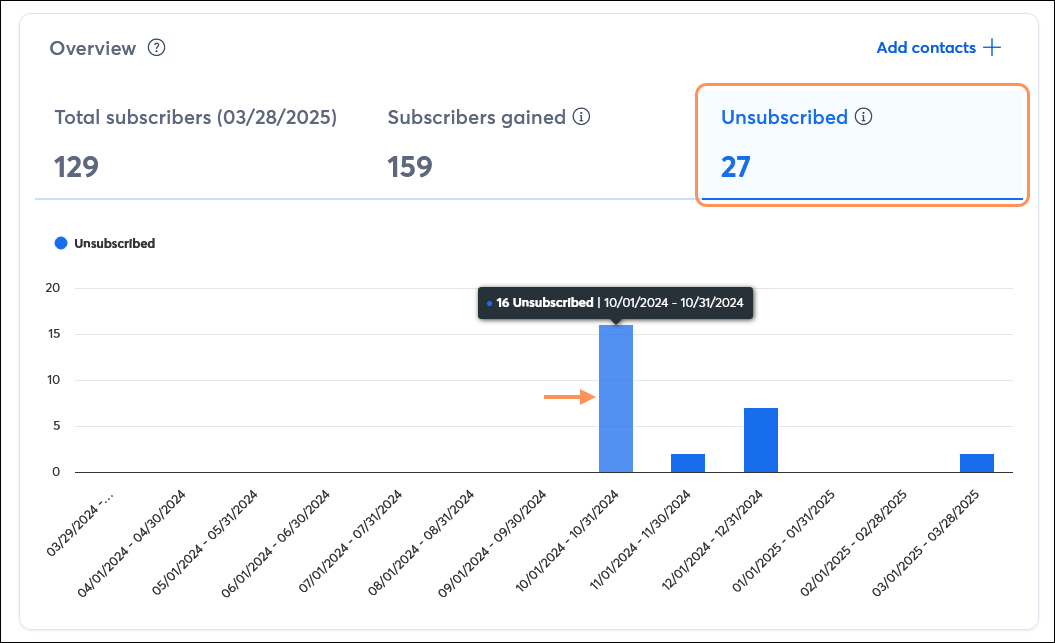
- Unsubscribed - This is the total number of contacts that unsubscribed during the given timeframe.
View your growth and unsubscribe analysis
When your list is growing steadily, a few unsubscribes isn't the worst thing in the world! You can see a detailed analysis of what tools are working for your and what the most common reasons for unsubscribes are so that you know where to focus your efforts.
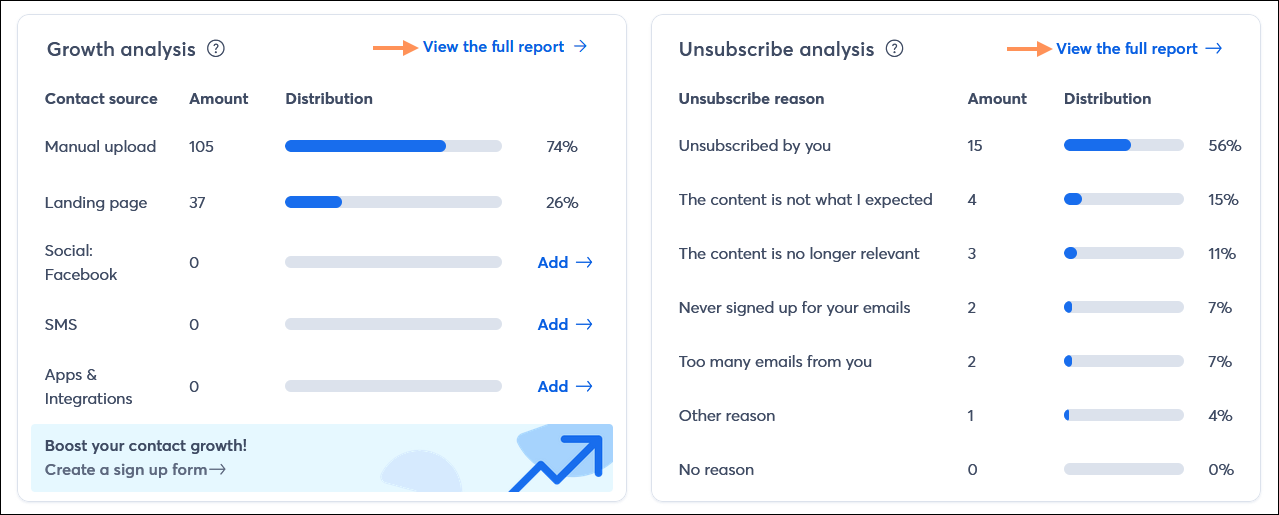
- Growth analysis - Your growth analysis shows the top five sources of contact growth. If you're using less than 5 contact sources, we give you some suggestions that can help grow your list too! Clicking the "View the full report" link lets you see a list of your new subscribers.
- Unsubscribe analysis - Your unsubscribe analysis shows the reasons why your contacts unsubscribe. Clicking the "View the full report" link lets you see the specific contacts that unsubscribed.
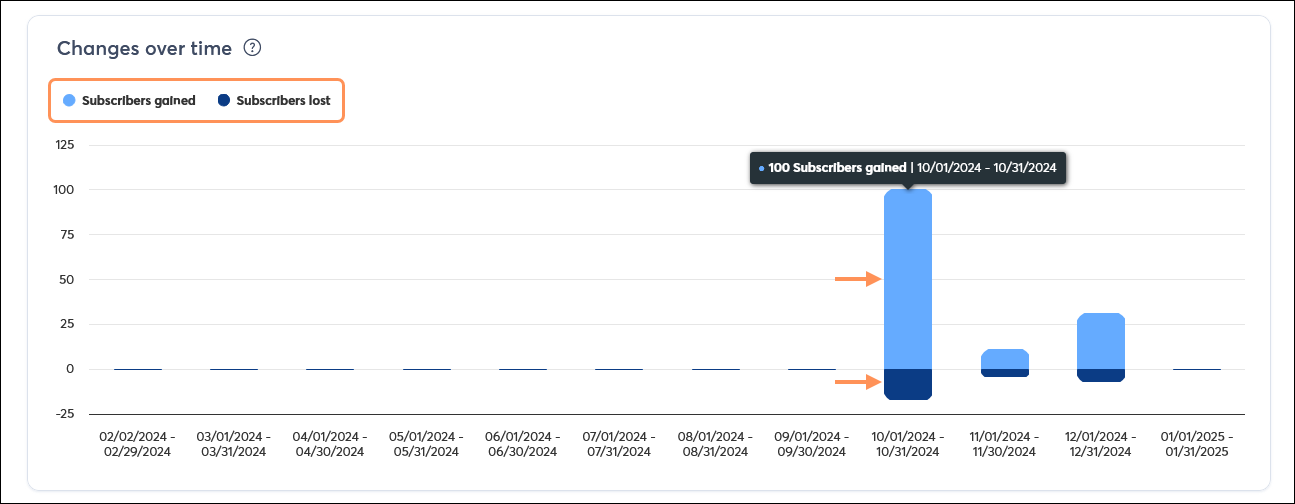
See changes over time
Compare your subscribers gained to your subscribers lost with an easy-to-read, stacked bar chart that helps you better understand the scale of your list growth efforts. Each bar in the chart is cumulative and can have two parts; subscribers gained is represented in the top part of the bar, and subscribers lost is represented at the bottom. For example, in the image below, the "Subscribers gained" portion of the bar is clicked, displaying the total number of new subscribers, but you can click the lower portion of the bar to see the "Subscribers lost" total for the same timeframe too. The bar appears in a single color if it only has one type of subscriber.
- Subscribers gained - This is the total number of new, active contacts added to your account, either through a sign-up tool or those that you added manually, within the given timeframe. Clicking the "Subscribers gained" heading in the upper left-hand corner of the chart removes the subscribers lost information, focusing on only the gained metric, and makes smaller numbers easier to see.
- Subscribers lost - This is the total number of contacts that either unsubscribed themselves, you manually unsubscribed, or you deleted from your account. Clicking the "Subscribers lost" heading in the upper left-hand corner of the chart removes the subscribers gained information, focusing on only the lost metric, and makes smaller numbers easier to see.
View your email campaign reports (mobile web)
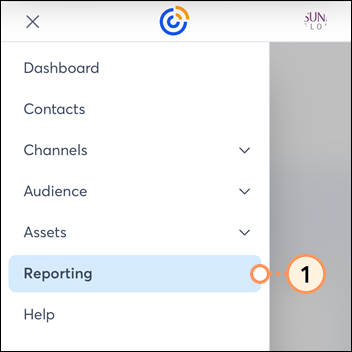
- Click the menu icon in the top left-hand corner of the screen and select the Reporting option.
- From the Contacts tab, you can select the timeframe for your reporting, and see an overview of your Total subscribers. Swipe left to see the Subscribers gained and Unsubscribed too!

- Scroll down to view your Growth analysis. Clicking the "View full report" link shows you the specific contacts that were added.

- Scroll down further to see your Unsubscribed analysis. Clicking the "View full report" link shows you the specific contacts that unsubscribed.

- Scroll down further to see your Changes over time to compare your subscribers gaind and lost in the selected timeframe.
