Email and Digital Marketing
How can we help you?
Search our help articles, video tutorials, and quickstart guides

You've got this. You've got us. Search our Knowledge Base to quickly find answers to your questions.

View your email reporting in your Starter Email account

Article: 000055247
Updated: July 7, 2026

See your email opens, clicks, bounces, and more, and compare your performance over time

The Reporting tab lets you see how your emails are performing and compare your rates to the industry averages.
Get an overview

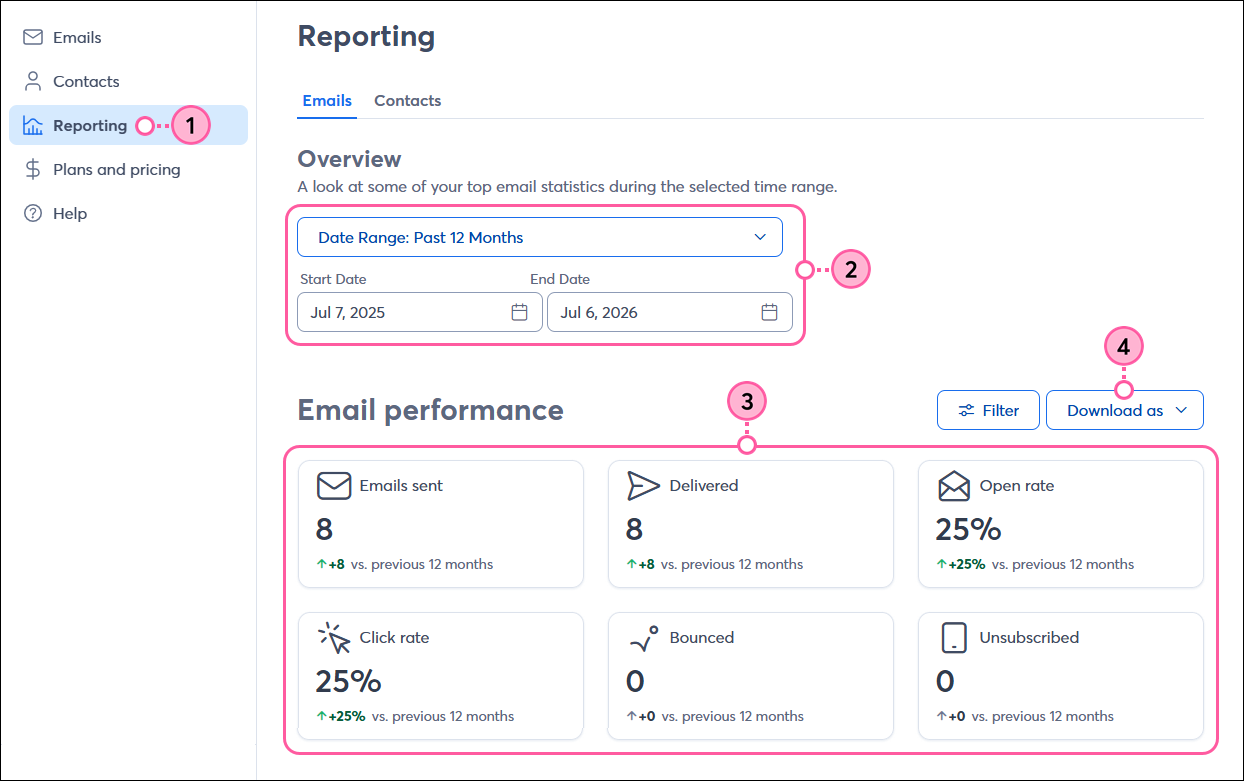
  1. From the left-hand navigation, click Reporting.
  2. In the Overview section, use the drop-downs to select a date range or enter a custom date range to view your email stats during that time.
  3. In the Email performance section, you’ll see your:
    • Emails sent - The total number of emails you’ve sent in the specified time period.
      • One send is defined as one email sent to one contact, so an email sent to 10 contacts = 10 sends.
    • Delivered - The total number of emails that were successfully delivered to your contacts during the specified time period
      • Delivered = Emails sent - Bounced
    • Open rate - The average open rate during the specified time period. 
      • Open rate = [Unique opens / (Sends - Bounces)] x 100
    • Click rate - The average click rate during the specified time period.
      • Click rate = [Unique clicks / (Sends - Bounces)] x 100
    • Bounced - The total number of emails that bounced during the specified time period.
    • Unsubscribed - The total number of contacts who unsubscribed during the specified time period.
  4. Click Download as to download the overview stats as a PDF or CSV file.

    Left navigation with Reporting tab selected, Overview section with date range options, Email Performance section with stats, and Download As button

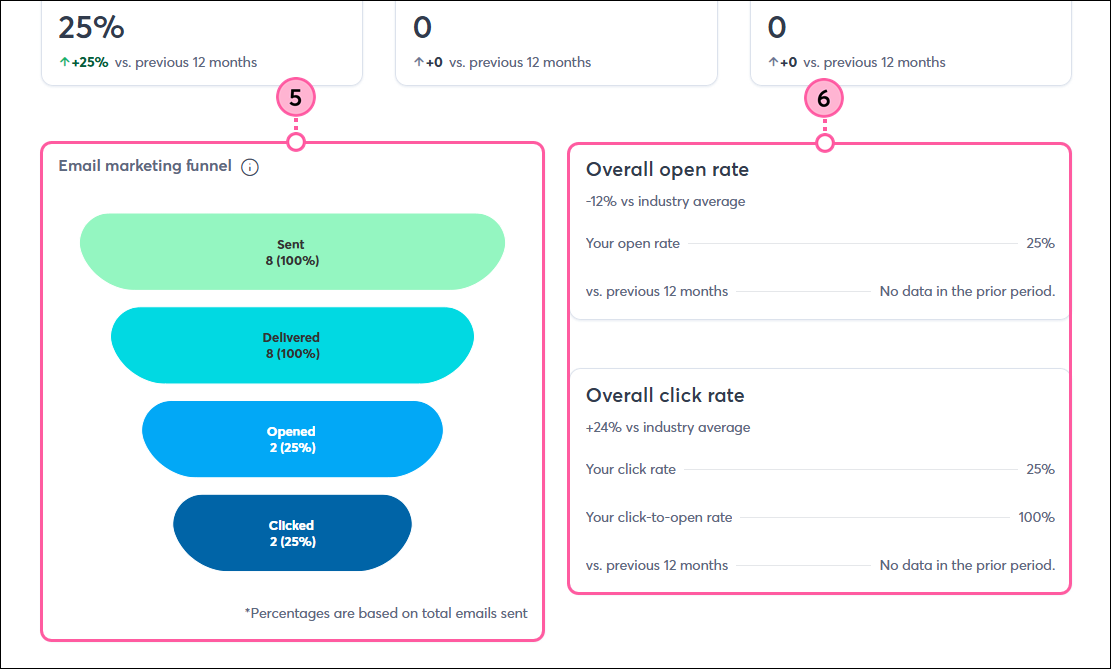
  5. The Email marketing funnel graph shows the stages of your contacts’ journey.
  6. View your overall open and click rates compared to the previous time period and compared to the industry average, if you've added your industry to your account settings. 
    Note: The click rate is calculated as [Unique clicks / (Sends - Bounces)] x 100, while the click-to-open rate is based on the number of email opens instead of successful sends. The click rate is a more accurate representation of your contact engagement.

    Reporting page with Email Marketing Funnel, Overall Open Rate and Overall Click Rate


View your email reports

In the Email campaigns section, you can see the performance of all your emails sent during the selected time period.
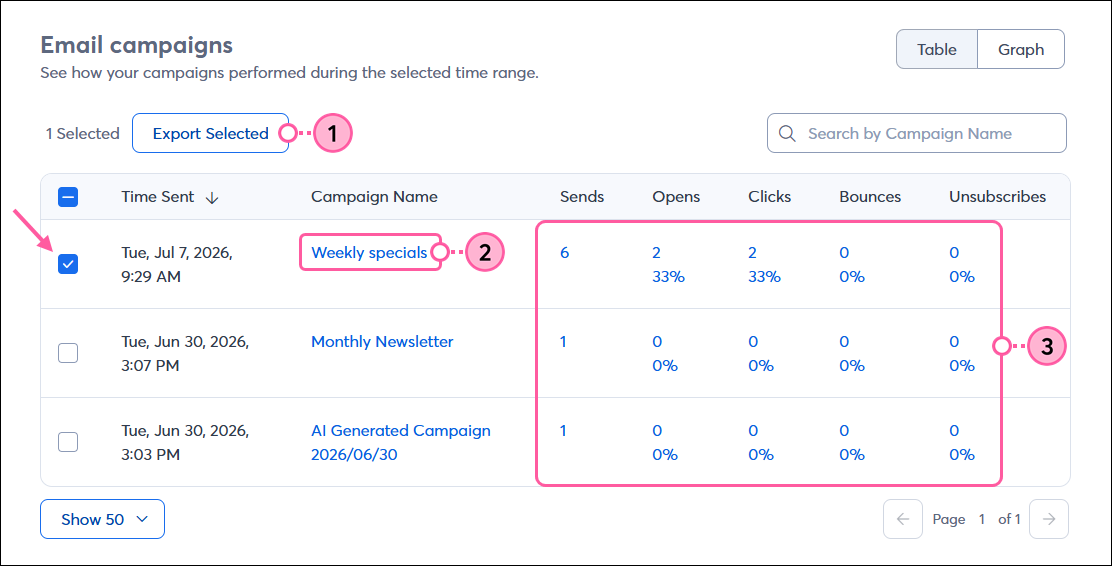
  1. From the Table view, your email reporting can be exported as a CSV by clicking the Export All button or selecting specific emails and clicking the Export Selected button.
  2. Click on the hyperlinked campaign name to view the email details.
  3. Click on the hyperlinked reporting numbers to view the individual contacts on that report:
    • Sends - This is the total number of contacts your email was sent to. Clicking the hyperlinked number will bring you to the email's Sent report.
    • Opens - This shows both the total number of unique opens for your email and the open rate. Clicking on either hyperlinked number brings you to the email's Opened report.
    • Clicks - This shows both the total number of unique clicks the links in your emails received and the click rate. Clicking on either hyperlinked number brings you to the email's Clicked report.
    • Bounces - This shows both the total number of bounces and the bounce rate for your email. Clicking on either hyperlinked number takes you to the email's Bounced report.
    • Unsubscribes - This shows both the total number of unsubscribed contacts and the unsubscribe rate for your email. Clicking on either hyperlinked number takes you to the email's Unsubscribed report.

      Email Campaigns table, checkboxes to select emails, Export Selected button, Campaign Name selected, and hyperlinked reporting stats

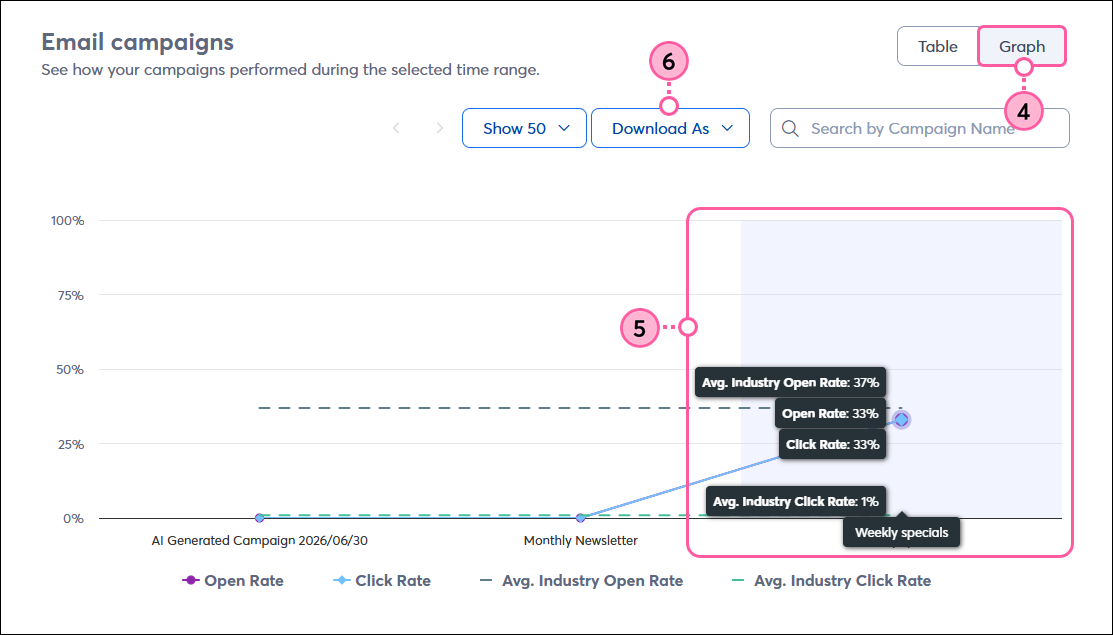
  4. Click the Graph button to see a visual representation of how your emails performed compared to each other and to the industry averages. 
  5. Roll your mouse over the graph to see the statistics for each email plotted.
  6. Click the Download As button to download the graph as a PNG, JPG, SVG, PDF, or CSV.

    Email Campaigns Graph, Email highlighted with stats plotted on graph, and Download As button


Questions?

Ask the Community

Did this article answer your question?


Constant Contact Logo

Copyright © 2026 · All Rights Reserved · Constant Contact · Privacy Center