After you've created and activated your Survey Page, shared it with your audience, and started receiving responses, it's time to view the results. Our reporting lets you see how many people started and completed your survey, view an overall summary of the results, and dig deeper into the individual responses.
After reviewing your survey's results, you can also segment your respondents to follow up with your contacts based on their feedback.
 | Did you know? A common response rate for a survey is 10-20%. Response rates can vary depending on factors like survey length, incentives, and whether potential participants care about the survey's topic. |
Where do I find the reporting for my Survey Page?
The reporting information is available on the Details page for your survey. Reporting isn't available for surveys that are in "Draft" status.
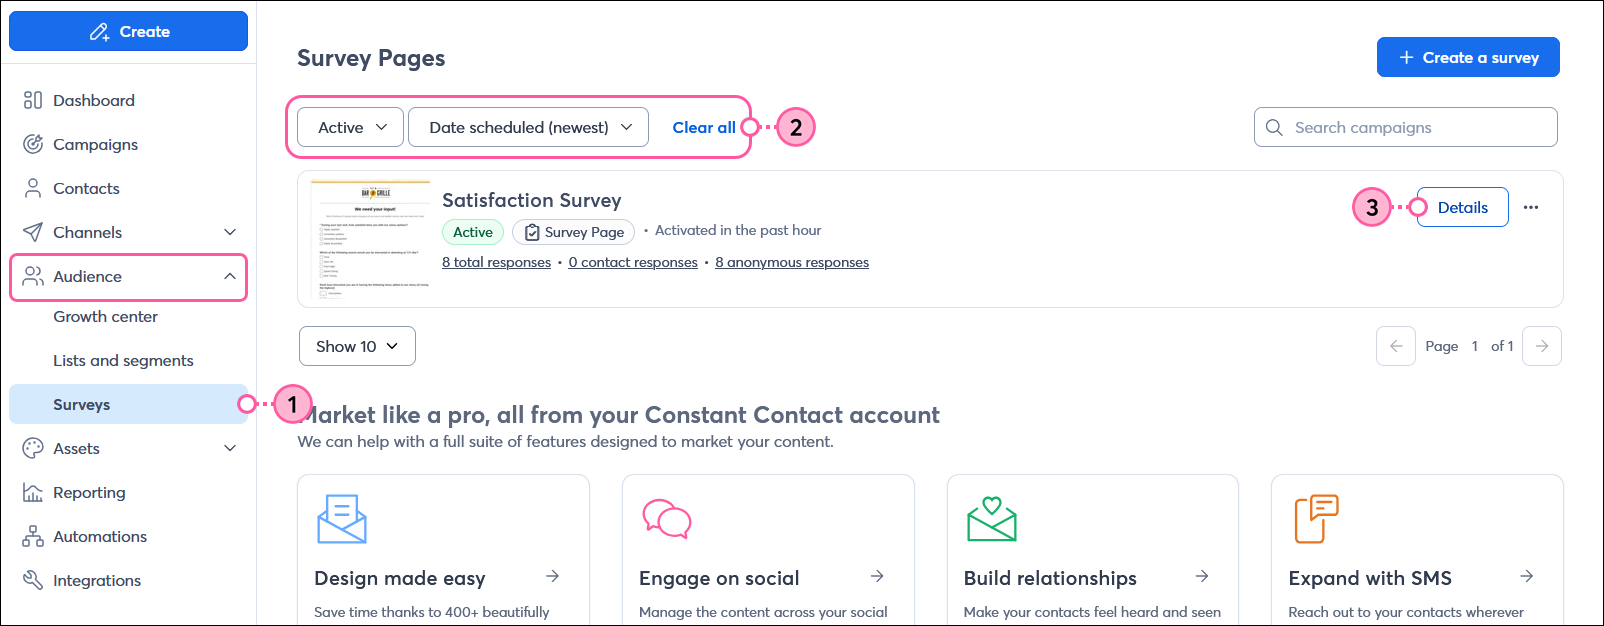
- From the menu on the left-hand side, click Audience > Surveys.
- Use the filters to help narrow your search:
- Select the "Active," "Inactive," or "Ended" option from the STATUS drop-down menu.
- Select an option from the SORT BY drop-down menu.
- Next to the Survey Page you want to review, click the Details button.
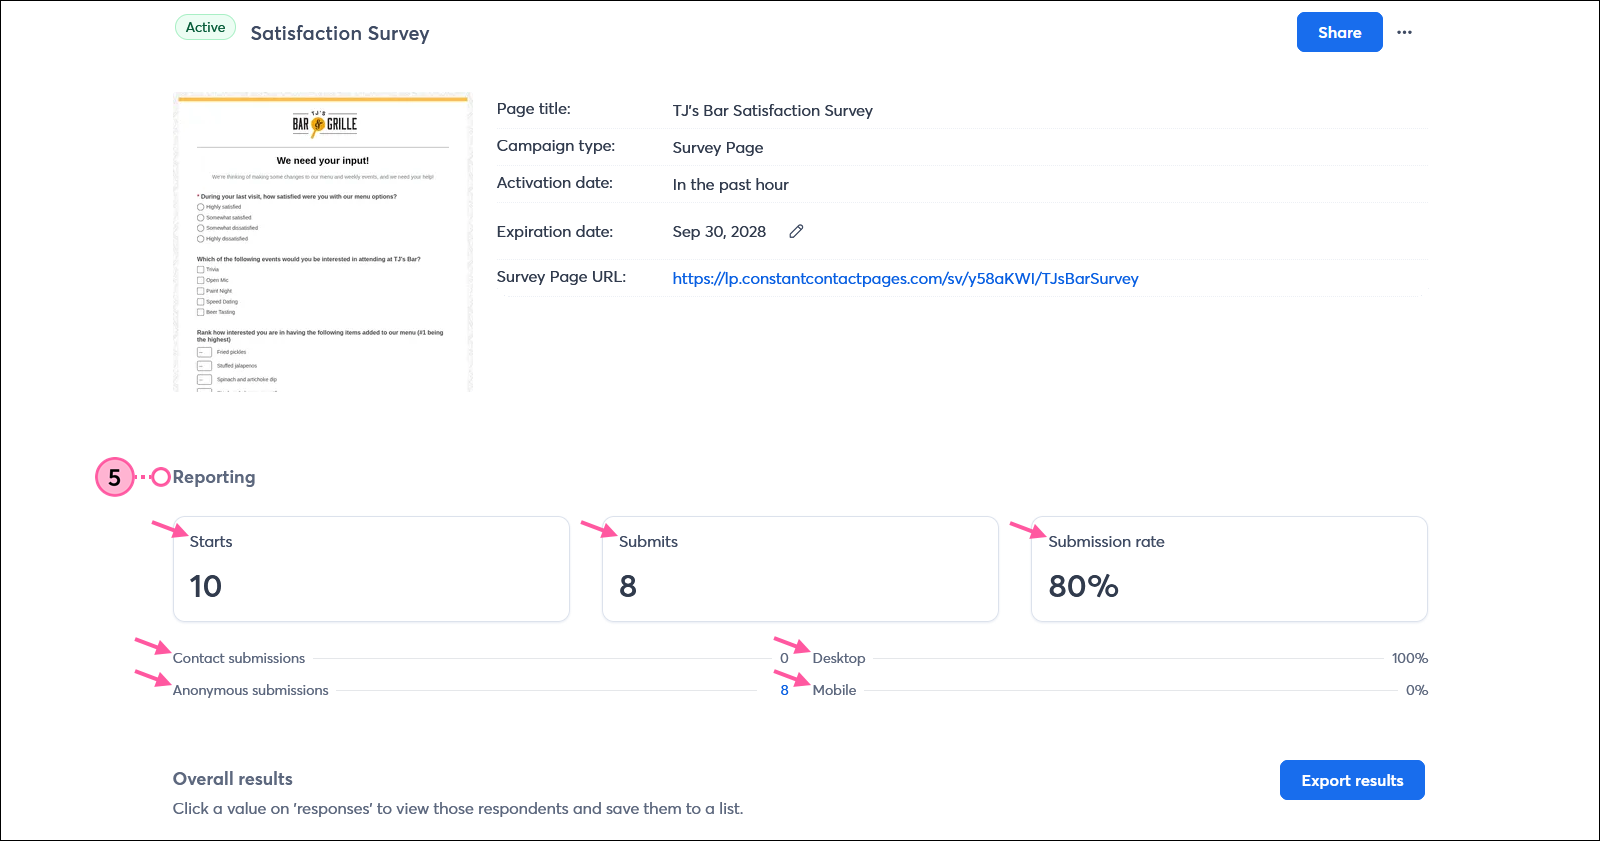
- The Reporting section at the top of the Details page shows you:
How do I review the responses to my survey questions?
The Overall results section breaks down the responses for each question included in your survey. Here's how to interpret each type of question:
Checkbox questions
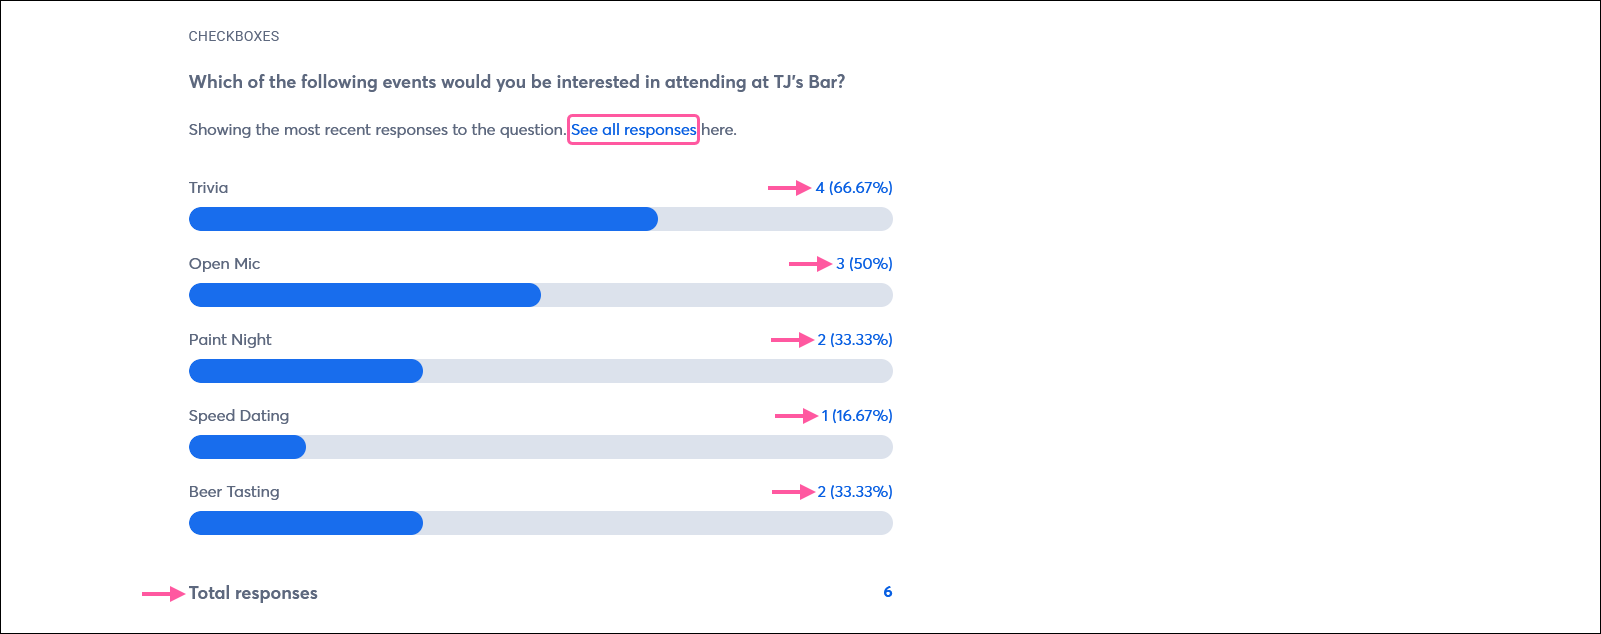
Checkbox questions let your survey respondents select more than one answer option so they can give a custom opinion.
- Bar chart - The reporting shows you each of the response options, and the number and percentage of times it was selected. The bar chart gives you a quick visual of how popular each option is so you can see the "winning" and "losing" options.
- Total responses - The total responses tells you how many people responded to the question. Since each person who responds to your survey can select more than one response, the total doesn't always match the sum of the response options.
- See all responses - Clicking the "See all responses" link lets you see the contacts that chose each specific answer, and you can filter anonymous responders from known contacts.
Multiple choice questions
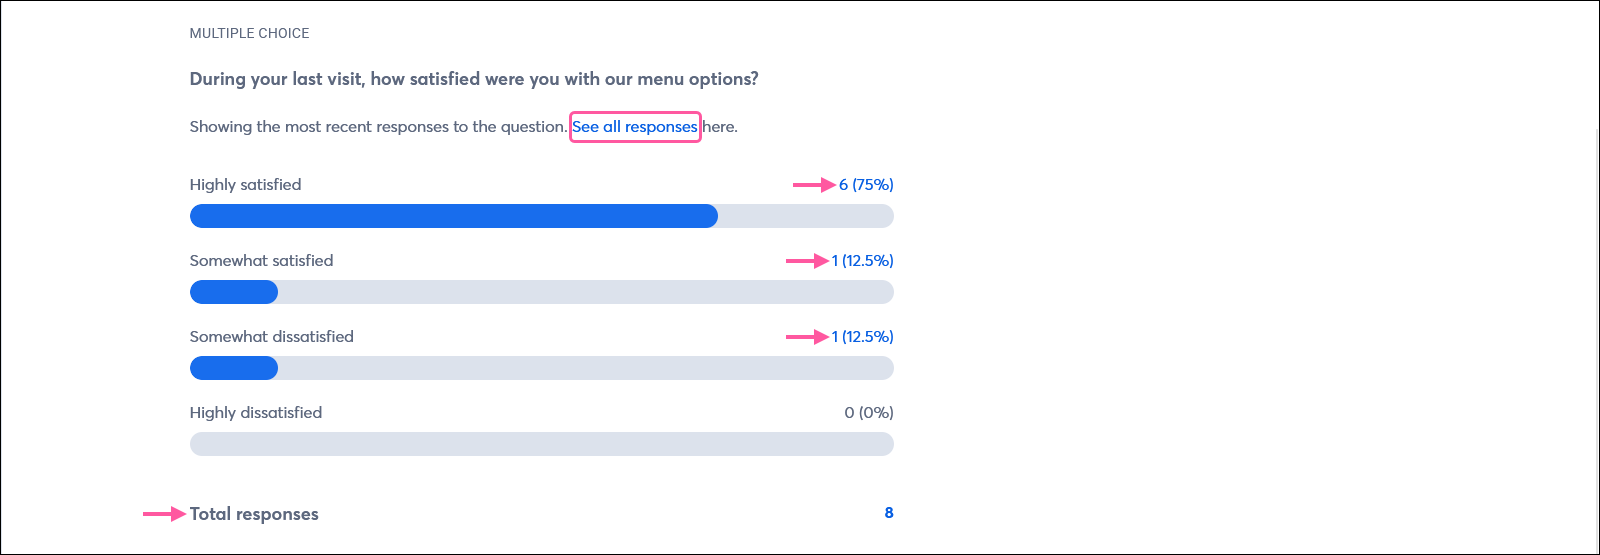
Your survey respondents can only select one option for multiple choice questions.
- Bar chart - The reporting shows you each of the response options, and the number and percentage of times it was selected. The bar chart gives you a quick visual of how popular each option is so you can see the "winning" and "losing" options.
- Total responses - The total responses tells you how many people responded to the question. Since each person who responds to your survey can only select one response, the number always matches the sum of each of the response options.
- See all responses - Clicking the "See all responses" link lets you see the contacts that chose each specific answer, and you can filter anonymous responders from known contacts.
Numeric scale
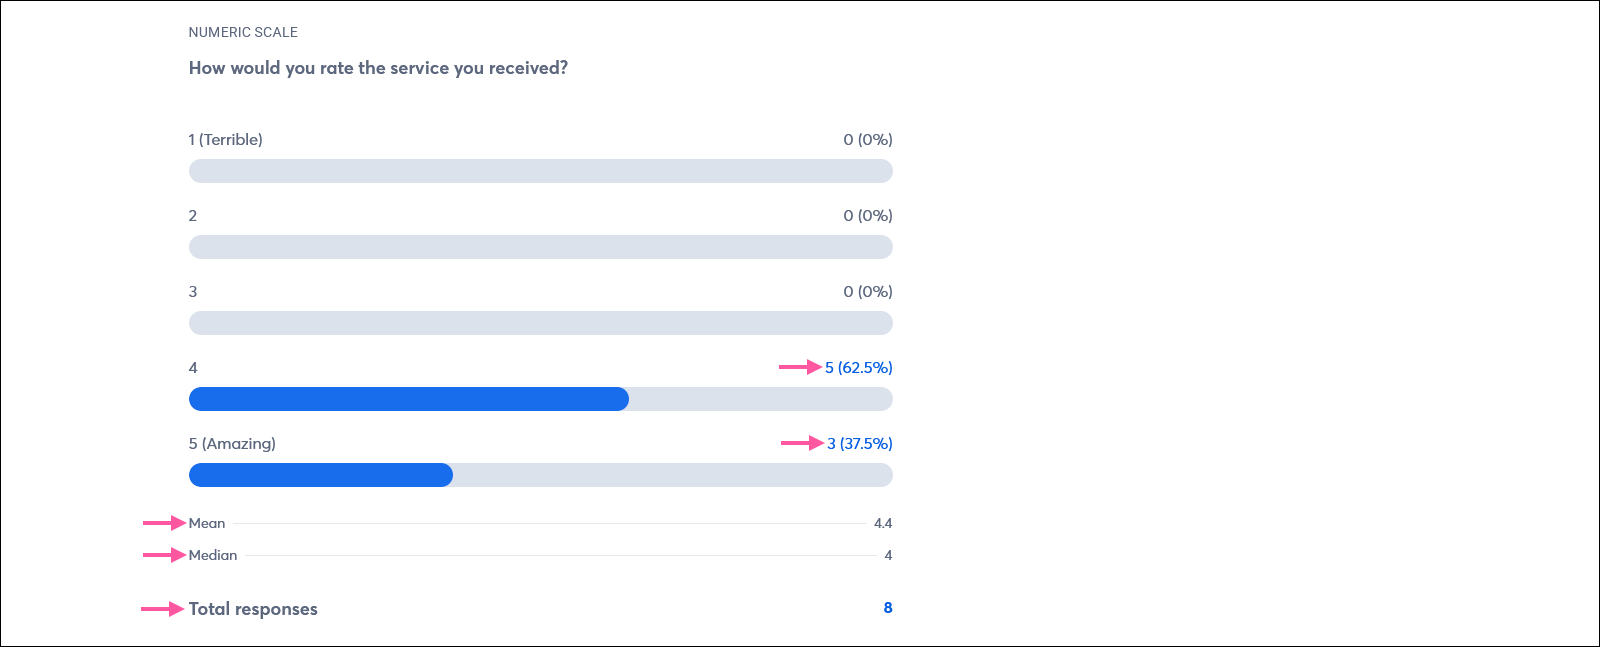
Your survey respondents can only select one option for numeric scale questions.
- Bar chart - The reporting shows you each of the response options, and the number of times it was selected. The bar chart gives you a quick visual of how popular each option is so you can see the "winning" and "losing" options.
- Mean and Median - You're also provided with the mean (average) ranking to show you the typical tendency of your survey respondents, and the median (middle) ranking to show you the center of your data, reducing the skew that outliers can have on the mean.
- Total responses - The total responses tells you how many people responded to the question. Since each person who responds to your survey can only select one response, the number always matches the sum of each of the response options. Clicking the hyperlinked number lets you see the contacts that chose each specific answer, and you can filter anonymous responders from known contacts.
Open answer questions
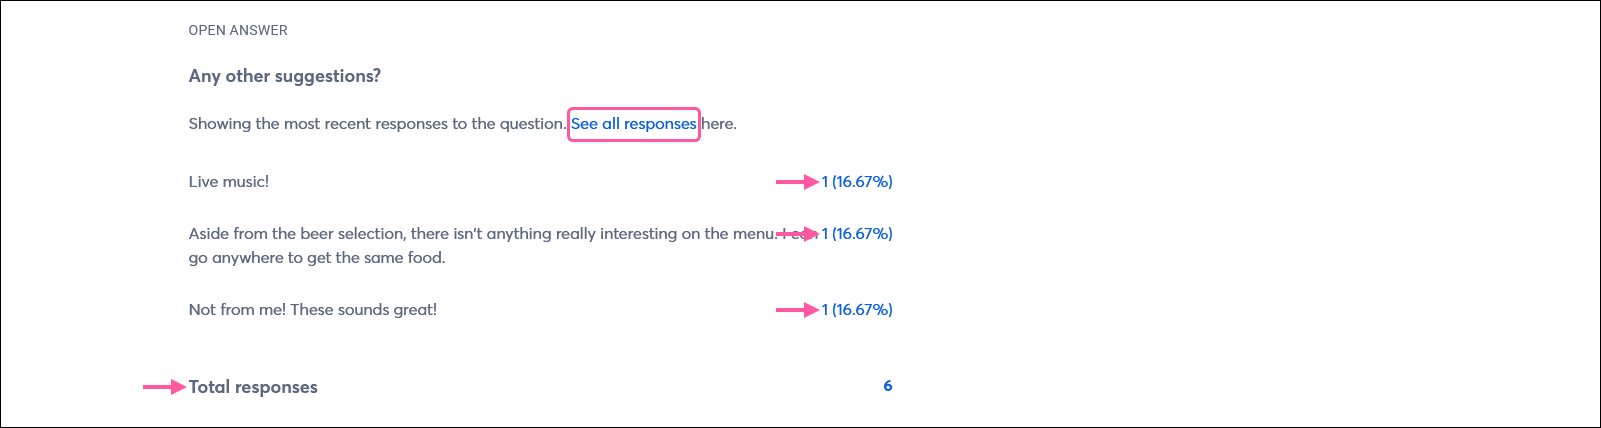
Open answer questions give each respondent one chance to say anything they'd like.
- List of responses - The reporting shows you the three most recent responses received. Each response is counted as an individual response, even if two responses with the same exact wording are provided from two different people. This also means that each response shares the same percentage of times it was provided. The more responses you have, the lower the percentage will be.
- Total responses - The total responses tells you how many people responded to the question. Since not all of the answers are displayed, the total responses figure is always going to be equal to or larger than the sum of the responses shown.
- See all responses - Clicking the "See all responses" link lets you view all of the answers provided, and see the contacts that provided each answer. You can also filter anonymous responders from known contacts.
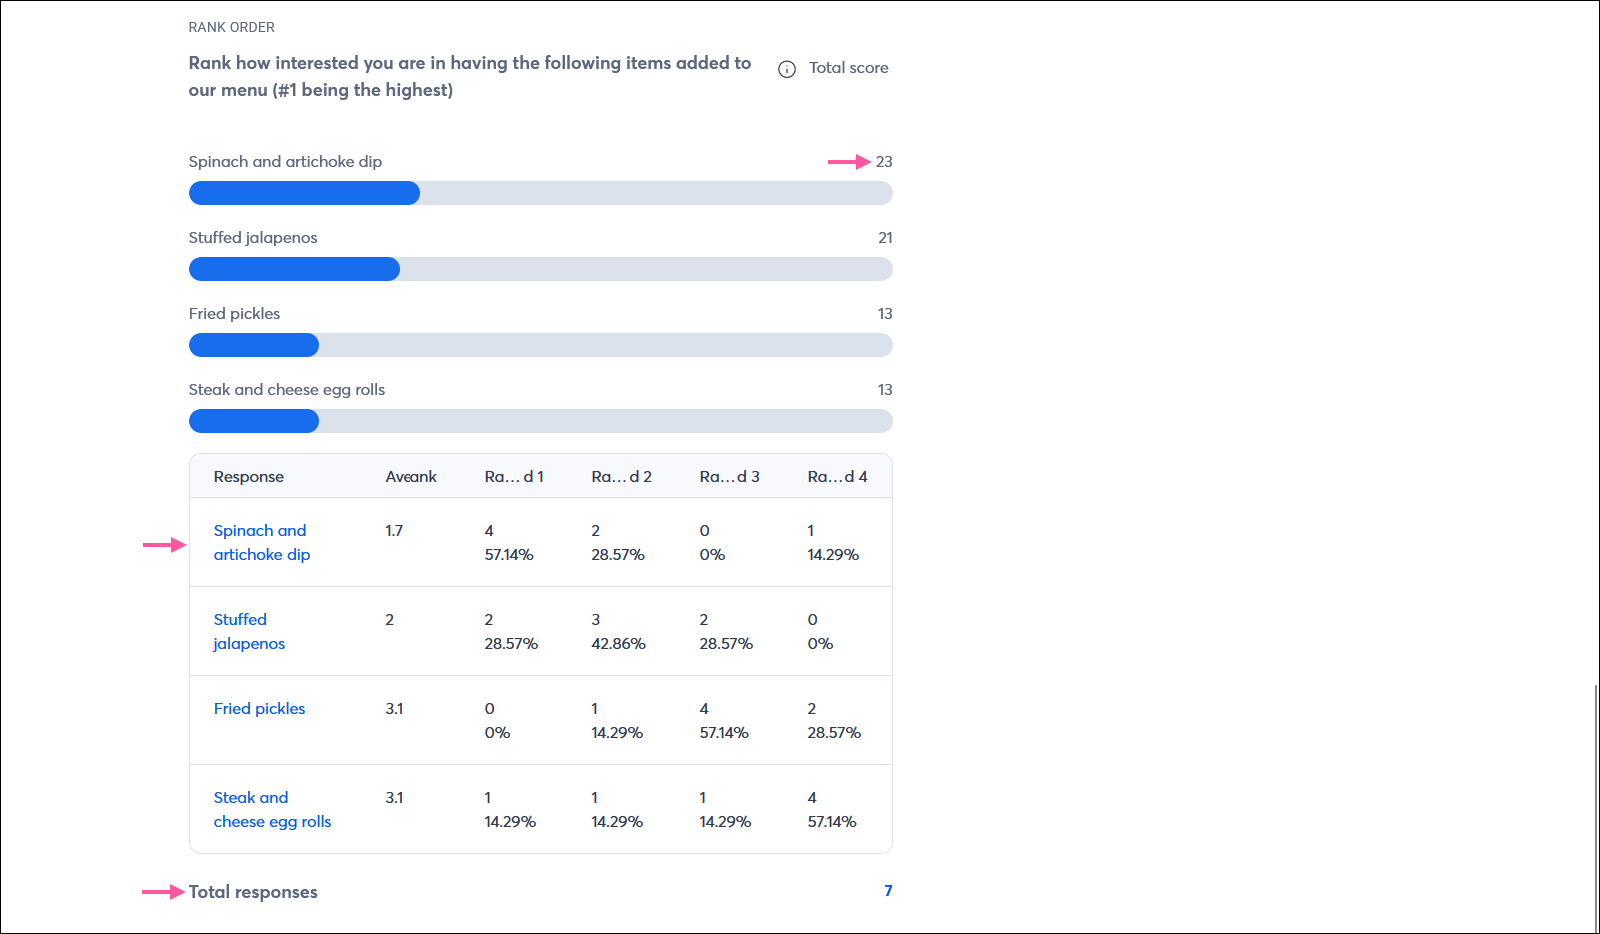
Rank order questions
Rank order questions let each responded put your response options in order from their most to least preferred.
How do I export the survey results?
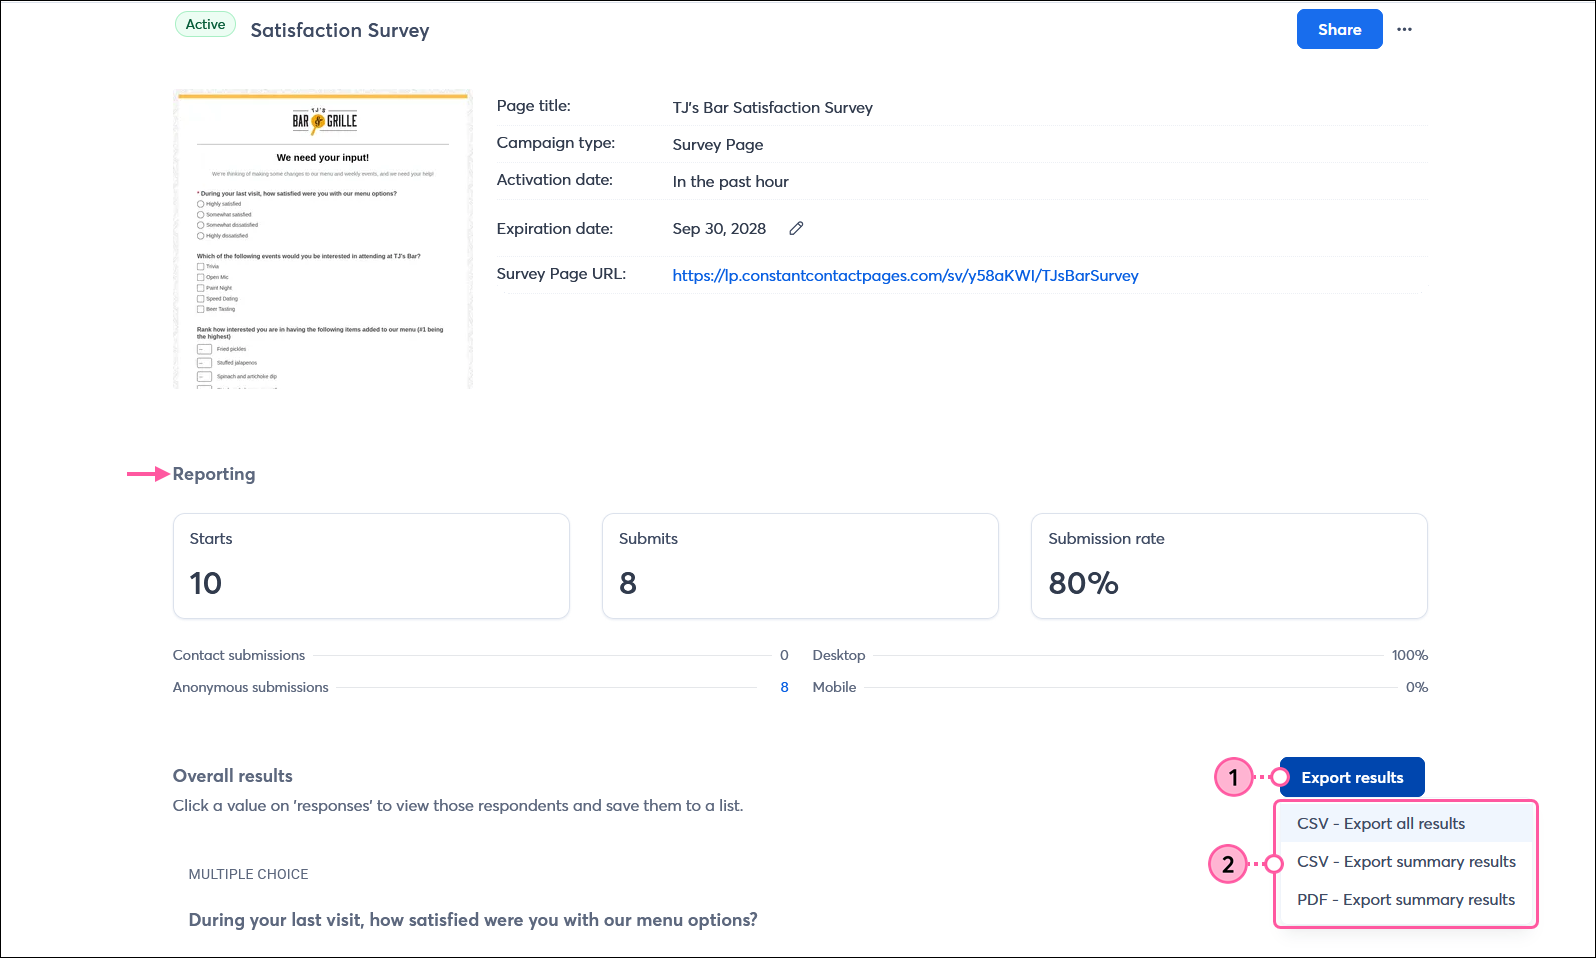
You can export a CSV file of all of your survey results, or you can export a summary of your results as a CSV or PDF file.
- Under the Reporting section for your survey, click the Export results button.
- Select the type of file you want to export. If you're not sure, you can view some examples of what the exported survey results look like.