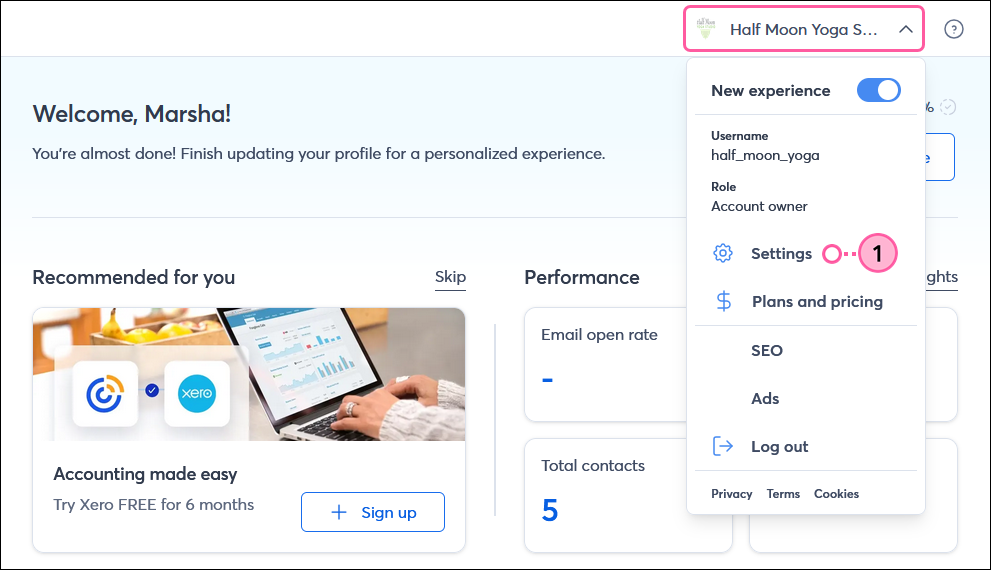
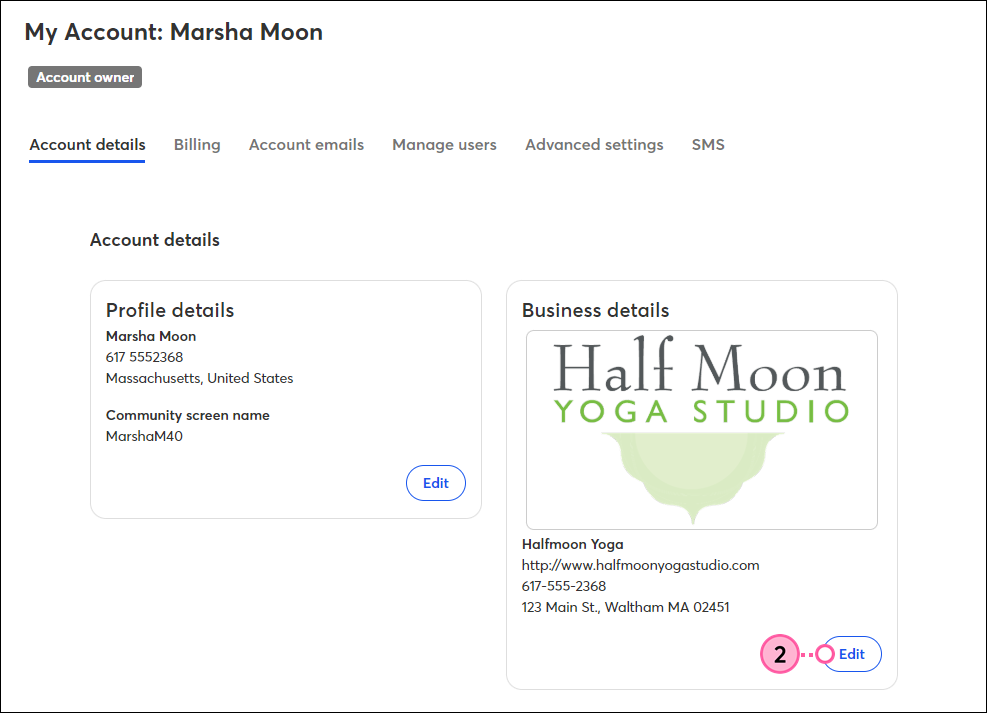
Completing your organization details helps us provide accurate tips, tools, and services so you get the most out of your account. When you select the industry you're in, you'll be able to see how your email stats compare to others in your industry when viewing your reporting.
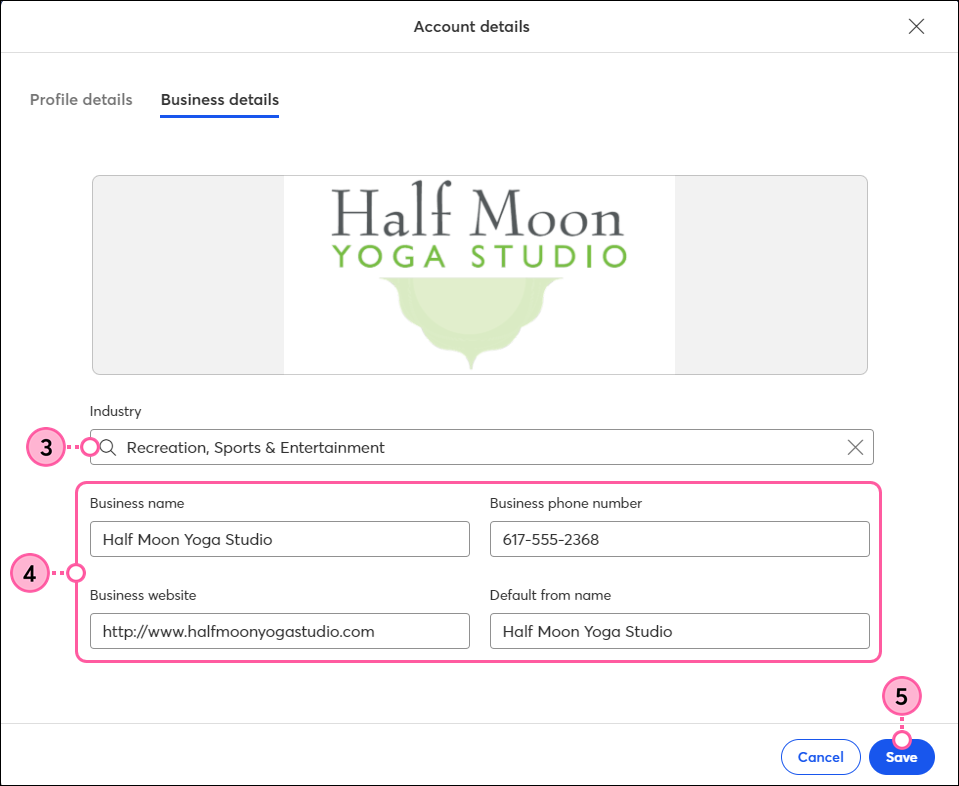
Now that your industry is up-to-date, when you check the reporting for your emails, you'll see how you compare to others in your industry.
Copyright © 2026 · All Rights Reserved · Constant Contact · Privacy Center