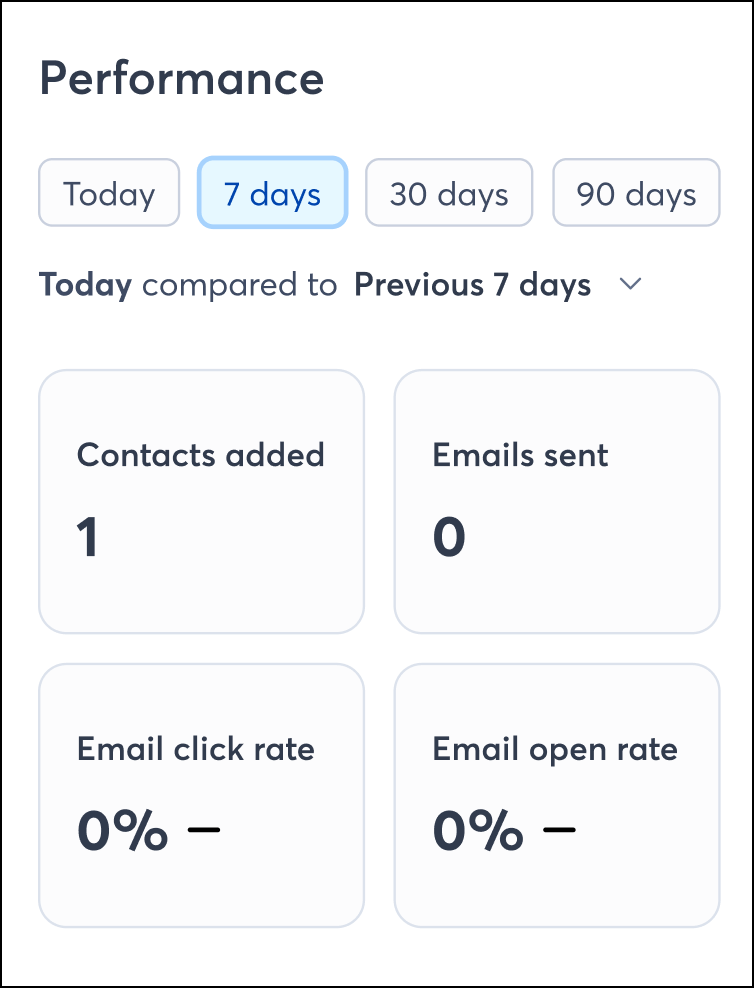
Get a snapshot of your performance from the home screen. Quickly view contacts added, emails sent, your email click rate, and email open rates for a selected time-frame. Use the Today, 7 days, 30 days, or 90 days toggle buttons to change the time frame.
For a more detailed look at your data, navigate to the Reporting tab in your application, where you can see metrics for:
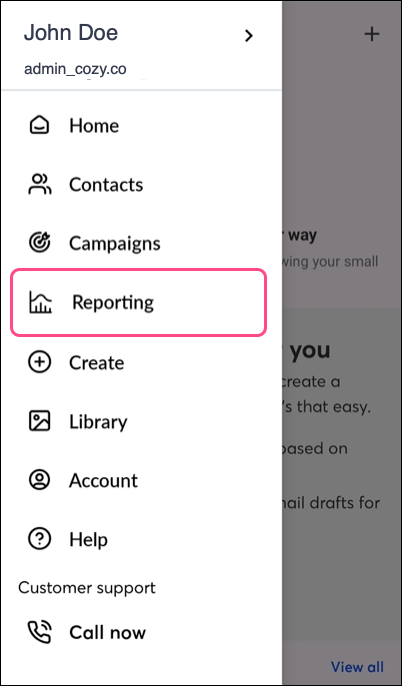
On Android, expand the navigation menu in the top left corner of the screen and select Reporting.
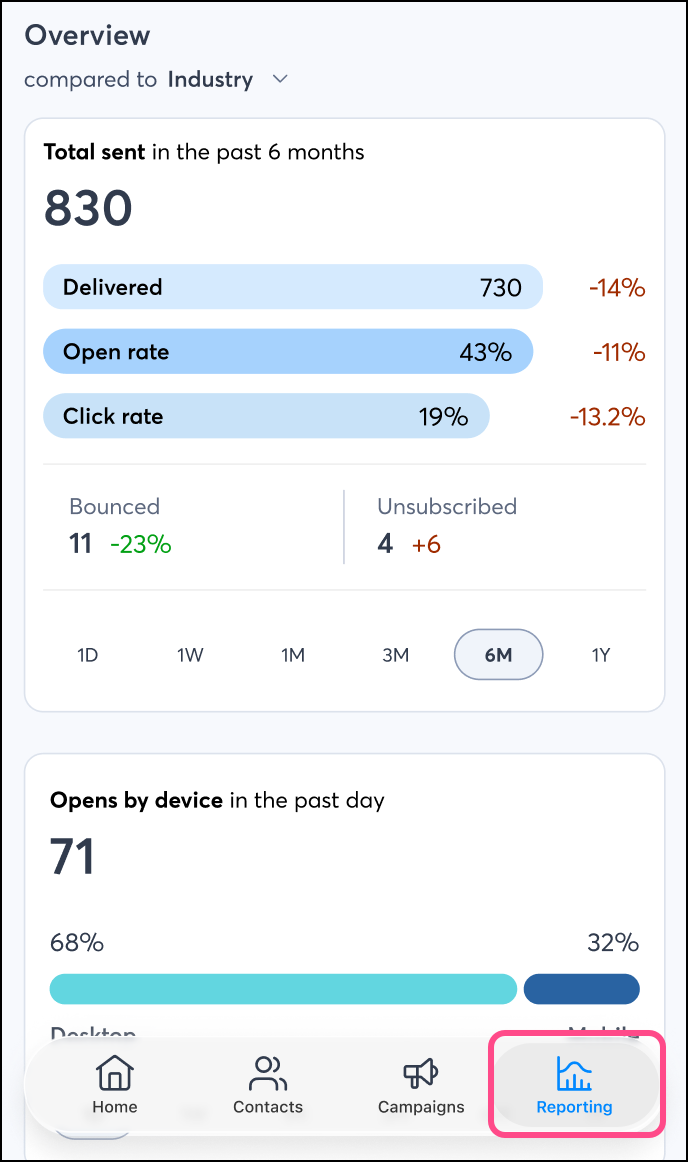
On iOS, tap Reporting from the bottom navigation menu.
To ensure the most accurate reporting, consider enabling bot click filtering.
Bot click filtering improves the accuracy of your email reporting and performance metrics by removing link clicks likely made by security programs, not real people. This also stops contacts from being added to segments or automation based on non-human activity, and gives you a more accurate view of your email engagement. Bot click filtering does not cover link clicks within SMS messages.
Bot click filtering can only be enabled on desktop from account settings. Read this to learn more about Bot click filtering.
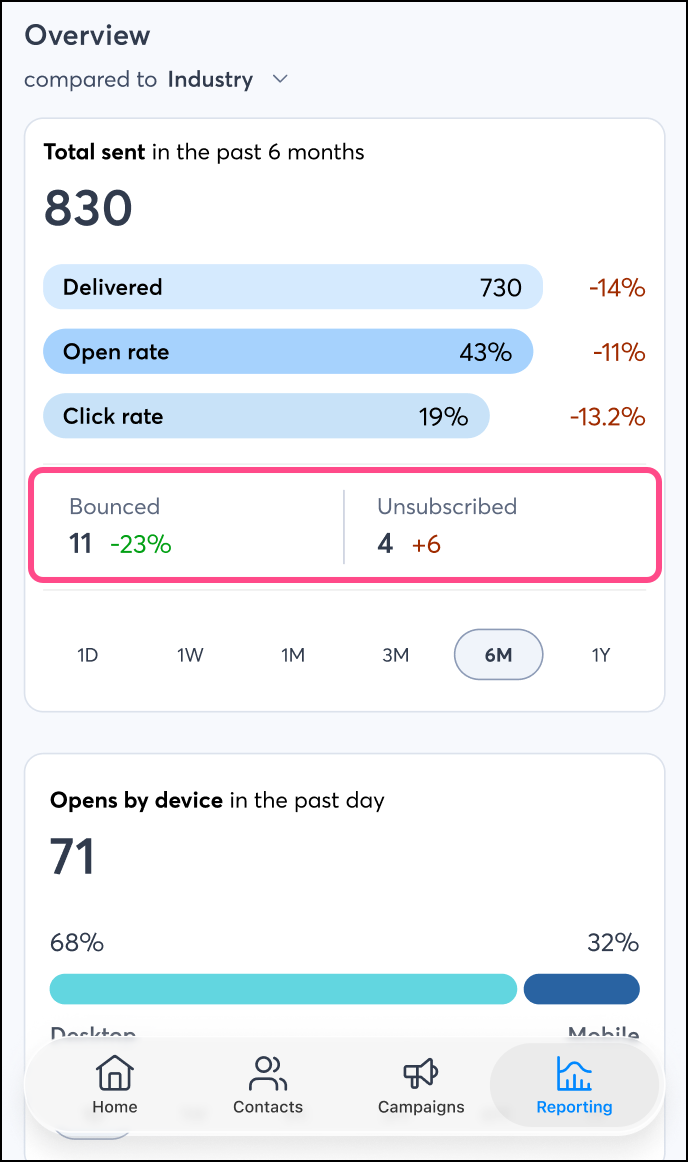
When you first access Reporting in the mobile app, you’ll see the Overview.
In Total Sent, quickly see the total number of emails sent within the selected time frame. Buttons at the bottom of the Total Sent section let you change the time frame—choose 1 day, 1 week, 1 month, 3 months, 6 months, or 1 year.
From those sends, you can see how many were successfully delivered (without bouncing), how many were opened, and where a link was clicked (any link) in your email.
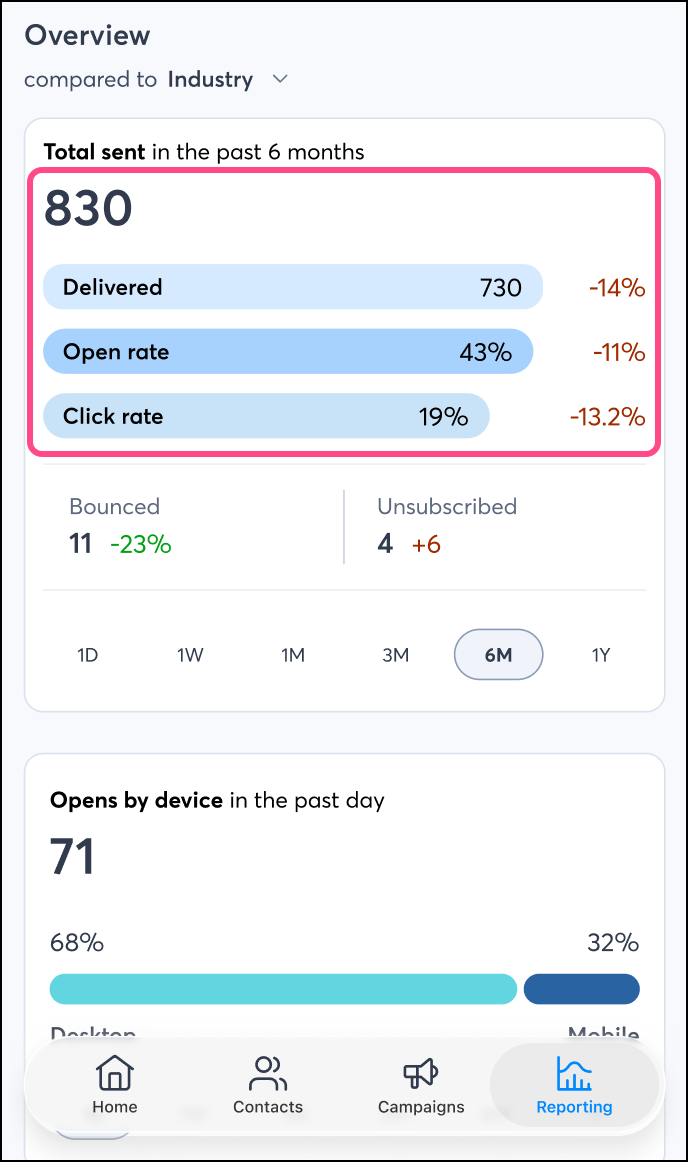
Below that, you can see how many bounced, and how many contacts unsubscribed from the unsubscribe link in that email.
Use the dropdown menu to compare your current metrics against the industry standard, a previous period, or the previous year.
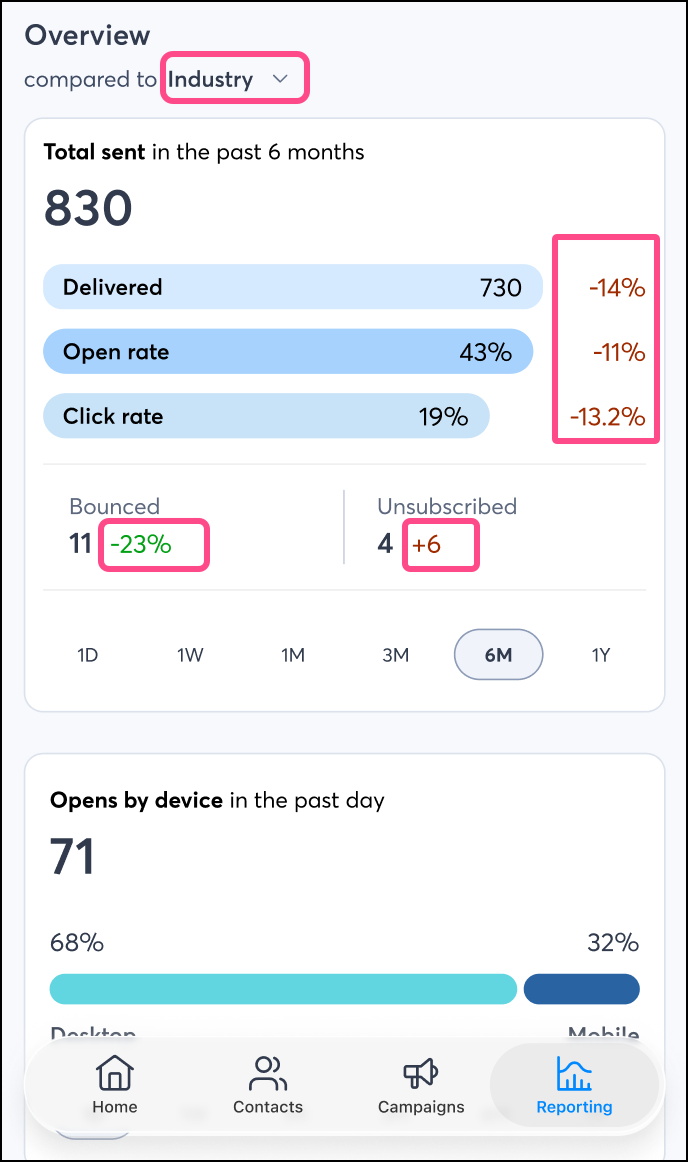
Your industry can be set from within your account settings. When you select the industry you're in, you'll be able to see how your email stats compare to others in your industry when viewing your reporting. Learn more.
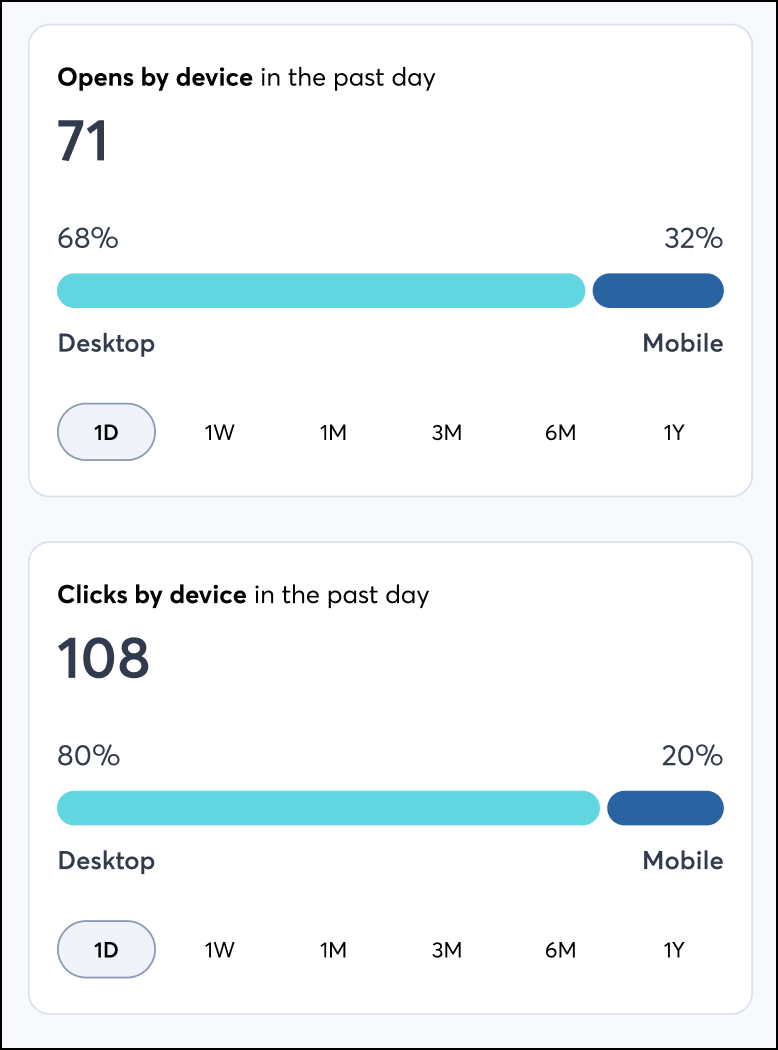
In Opens by device and Clicks by device, see how your email opens and clicks break down by desktop or mobile.
Buttons at the bottom of each section let you change the time frame—choose 1 day, 1 week, 1 month, 3 months, 6 months, or 1 year.
Copyright © 2026 · All Rights Reserved · Constant Contact · Privacy Center